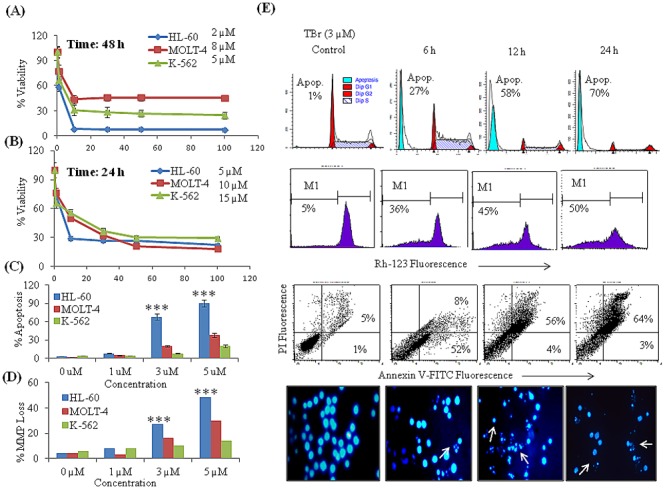
Figure 1. TBr inhibited cell proliferation in leukemia cell lines.

(A–B) Cell proliferation assay. Cells were treated with 1, 10, 30, 50 and 100 µM concentrations of TBr for 24 and 48 h. Cells were subjected to MTT assay to analyze cell proliferation. (C) DNA cell cycle analysis for subG1 population. Cells were treated with TBr for 24 h at indicated concentrations and stained with PI to determine DNA Fluorescence. SubG1 DNA population having <2n DNA were analyzed by ModFit software. (D) Mitochondrial membrane potential loss. Cells were treated with various concentrations of TBr for 24 h and stained with rhodamine-123. MMP loss was analyzed by flow cytometry and a decrease in rhodamine-123 fluorescence was taken as indicative of MMP loss. (E) TBr (3 µM) increased subG1 population, triggered MMP Loss, increased annexin V positive apoptotic cells and induced apoptotic bodies’ formation in HL-60 cells. Data are mean ± SD of three similar experiments and statistical comparisons of TBr treated HL-60 vs MOLT-4 and K-562 cells were made by using the Bonferroni method, p value<0.05 was considered significant, ***p<0.001.
