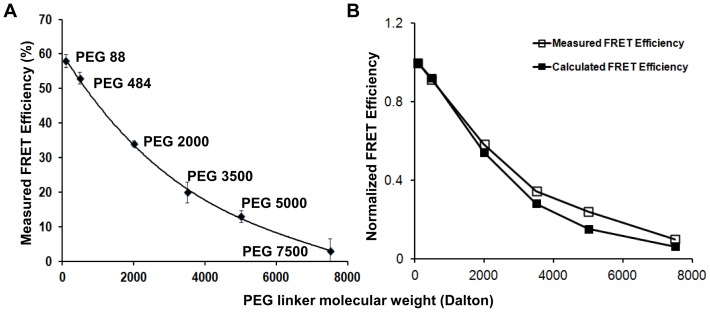
Figure 3. FRET between streptavidin on plastic plates and IEkMCC tethered with PEG polymers.
(A) Measured FRET efficiencies of IEkMCC tethered with six different PEG polymers. The intensity of DyLight 549 was captured before and after DyLight 649 was photobleached. The measured FRET efficiency ( ) was calculated using the intensity of DyLight 549 before (
 ) and after (
 ) DyLight 649 photobleaching (
 ). The averaged values of two measurements were plotted with standard deviations. (B) After normalization, the measured FRET efficiencies match those calculated based on the Flory radius (
 ) of the PEG polymers. The
  of the PEG polymer of
  subunits and unit length
  was calculated using
  , where
  is 0.28 nm [32]. Theoretical FRET efficiency (
 ) was calculated using the equation
  , where the Förster distance (
 ) of the DyLight 549-DyLight 649 donor-acceptor pair is 5 nm and the distance between the pMHC ligand and streptavidin
  is
is  of the PEG polymer plus the pMHC radius of 2 nm. The FRET efficiencies were normalized by dividing the FRET efficiencies by the FRET efficiency of PEG 88.

