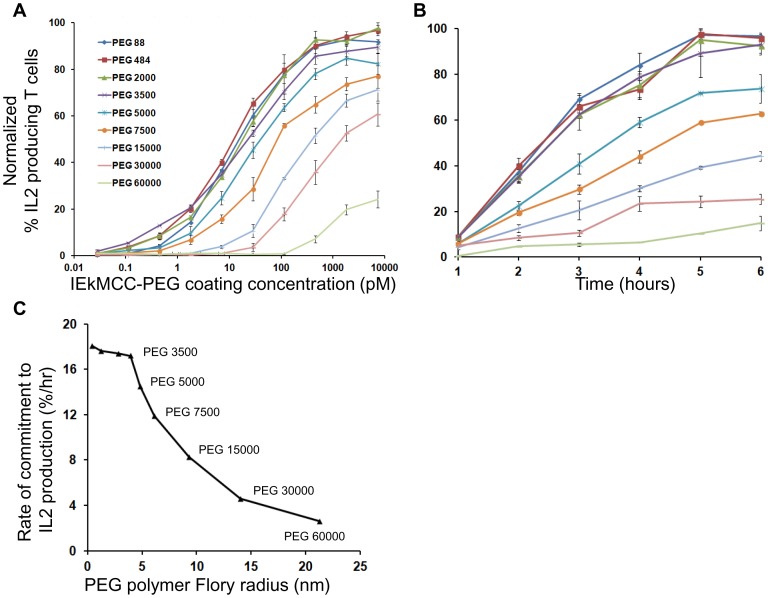
Figure 4. T cell activation by IEkMCC tethered with PEG polymers of different lengths.
(A) T cell IL2 production in response to IEkMCC-PEG ligands of varying coating densities after 6 hours of stimulation. Data are representative of three independent experiments. The percent of T cells producing IL2 was determined by intracellular staining and flow cytometry. Three experiments using T cells from three different mice were performed (see Fig. S8 for flow cytometry plots). The percent of T cells producing IL2 was normalized to the highest value in each experiment. The data points are averages of the normalized values with standard errors of the means. (B) The rate of T cell response to IEkMCC ligands tethered with PEG polymers of different lengths. T cell IL2 production in response to stimulation on 96 well plates coated with 110 pM IEkMC-PEG ligands. T cells were harvested every hour for 6 hours and levels of IL2 expression were assayed by flow cytometry. Three experiments using T cells from three different mice were performed (see Fig. S9 for flow cytometry plots). The percent of T cells producing IL2 was normalized to the highest value in each experiment. The data points are averages of the normalized values with standard errors of the means. (C) The rates of T cell IL2 responses to IEkMCC ligands tethered with PEG polymers were extracted from the slope of linear fitting curves in Fig. 4B and plotted against the Flory radius of the polymers. The linear regressions and equations for deriving the rates are shown in Fig. S7.

