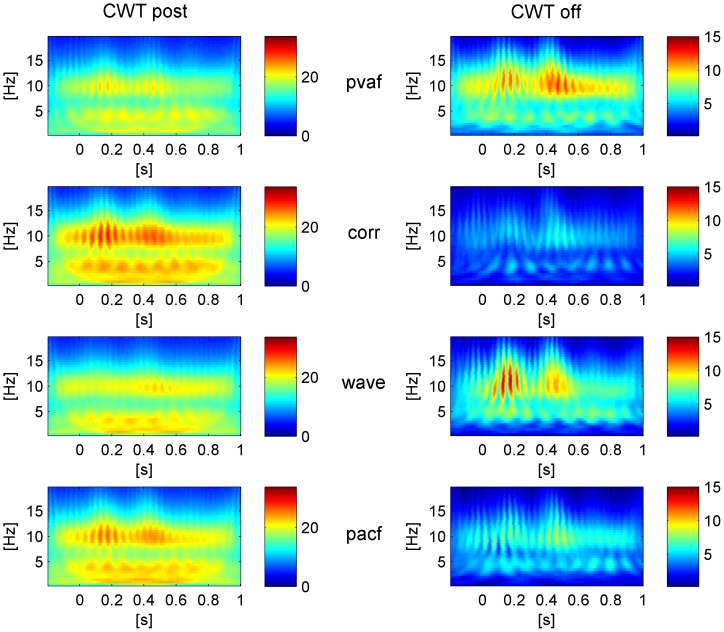
Figure 7. Group level based CWT (absolute values).
Left: CWT of the EEG signals after correction (CWTpost) with the four selection criteria, averaged across R epochs and occipital channels. Right: CWT of the EEG signals removed by each ICA correction (CWToff), averaged across R epochs and occipital channels. The shown correction is relative to ICA calculation based on the PA intervals (ICA_R).

