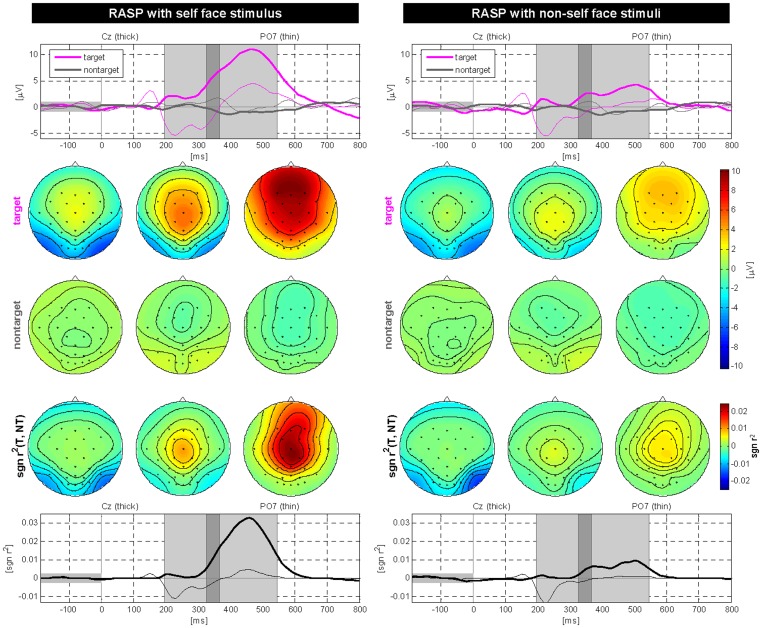
Figure 7. Grand average ERPs and scalp topographies for the self-face and non-self-face stimuli of the RASP-F condition.
Top row: ERPs for targets and nontargets at two selected electrodes Cz and PO7. The three shaded areas extract 3 discriminative intervals. Scalp maps are shown underneath using these intervals. Center: The first and second row of scalp plots indicate the ERP responses to the target and nontarget classes. Bottom row: Temporal distribution based on sgn r at two selected electrodes Cz and PO7. ERPs resulting from the self-face stimulus show stronger responses as those of the non-self face stimulus.

