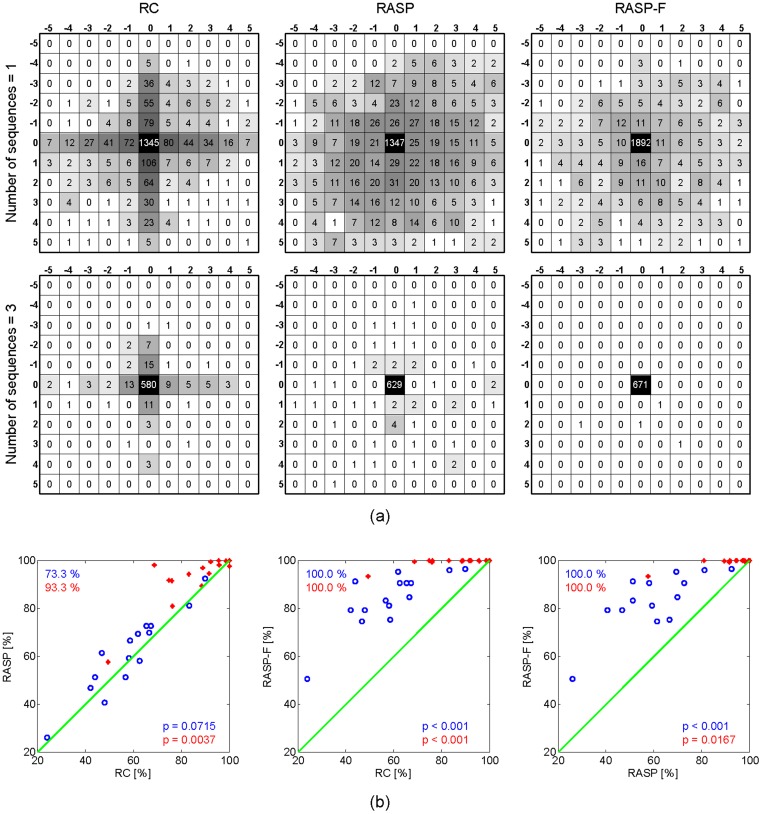
Figure 9. Performance comparison across spellers as number of sequences is increased.
Blue circles used one repetition and red stars three repetitions. (a) Error distributions for the RC (left), RASP (center), and RASP-F (right). All target items have been centered in each matrix. The number in a black centered cell corresponds the number of correct selections and numbers in other cells represents the number of error corrected selections occurring in each cell relative to the target location for each speller. (b) Scatter plot comparing classification accuracies and significance values of various combinations of the three conditions. Each circle represents the classification accuracy of one subject.

