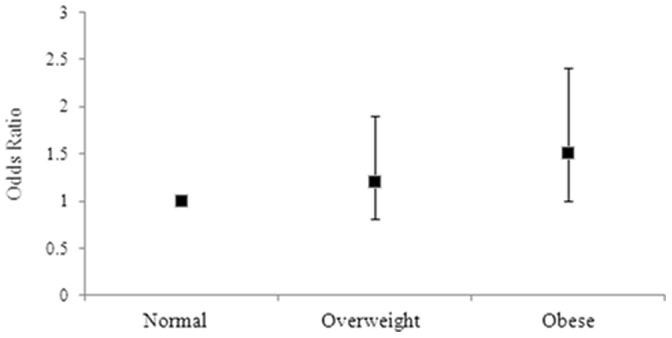
Figure 2. Adjusted odds ratios for men with EDS for BMI groups.

Error bars represent the 95% CI. Group 1 (ideal BMI) is the reference group, with a broken line indicating the threshold of significance.

Error bars represent the 95% CI. Group 1 (ideal BMI) is the reference group, with a broken line indicating the threshold of significance.