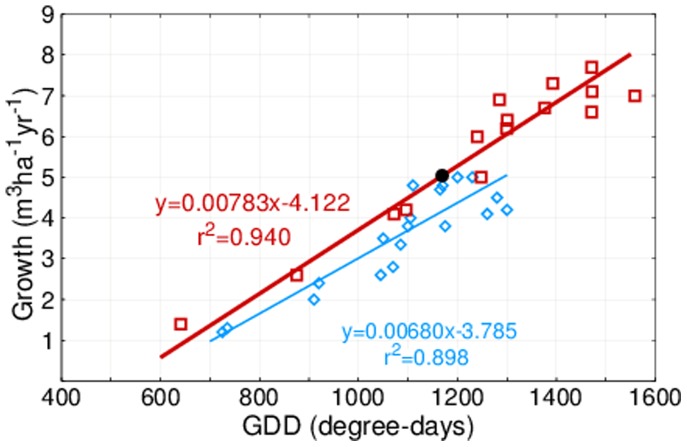
Figure 3. Regressions relating forest growth to Growing Degree Days.
The new regression (red) referring to 2006–11 is based on data from the 15 regions shown in Figure 1. The black dot on the red line shows the area-weighted average of all 15 regions. The old regression (blue) as published in [8] was based on 19 data points as recorded in the mid-20th century.

