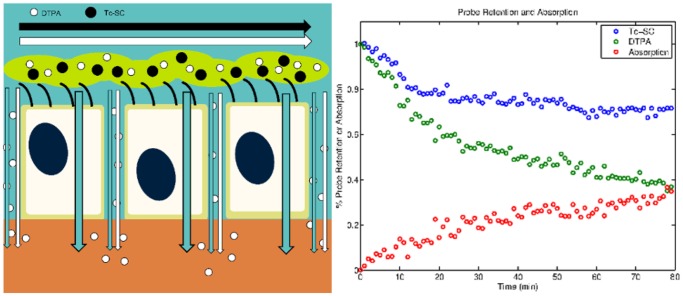
Figure 1. Left panel: schematic of transport routes in the airway epithelium.
The black and white horizontal arrows represent mucociliary clearance of Tc-SC and DTPA, respectively. DTPA (downward white arrow) absorbs across the airway epithelium via the paracellular route. Water (downward blue arrow) also absorbs across the epithelium via the transcellular and paracellular route. Right panel: normalized Tc-SC (blue circles) and DTPA (green circles) retention curves with the difference between the respective datasets at each time point shown as absorption (red circles) in CF subject 8.

