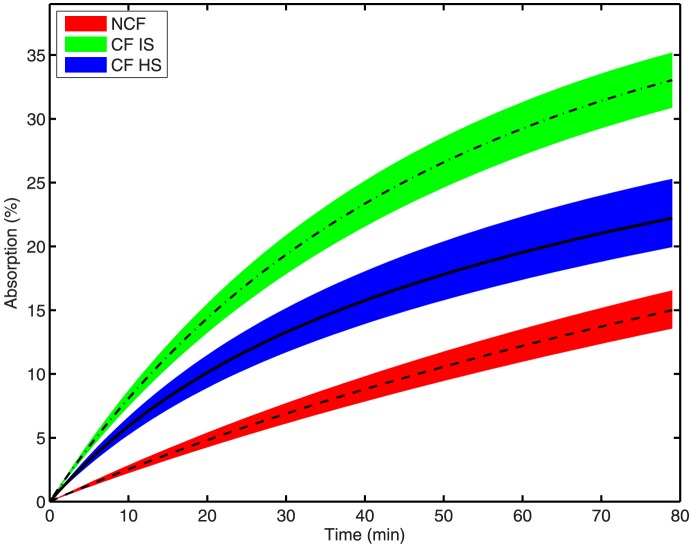
Figure 6. Estimated DTPA absorption trajectories for three groups.
Non-CF (red with dashed line), CF IS (green with dotted dashed line), CF HS (blue with line). Shaded envelope characterizes 95% confidence interval (CI) of retention prediction by the model. Pediatric CF subjects not shown due to overlap with adult CF.

