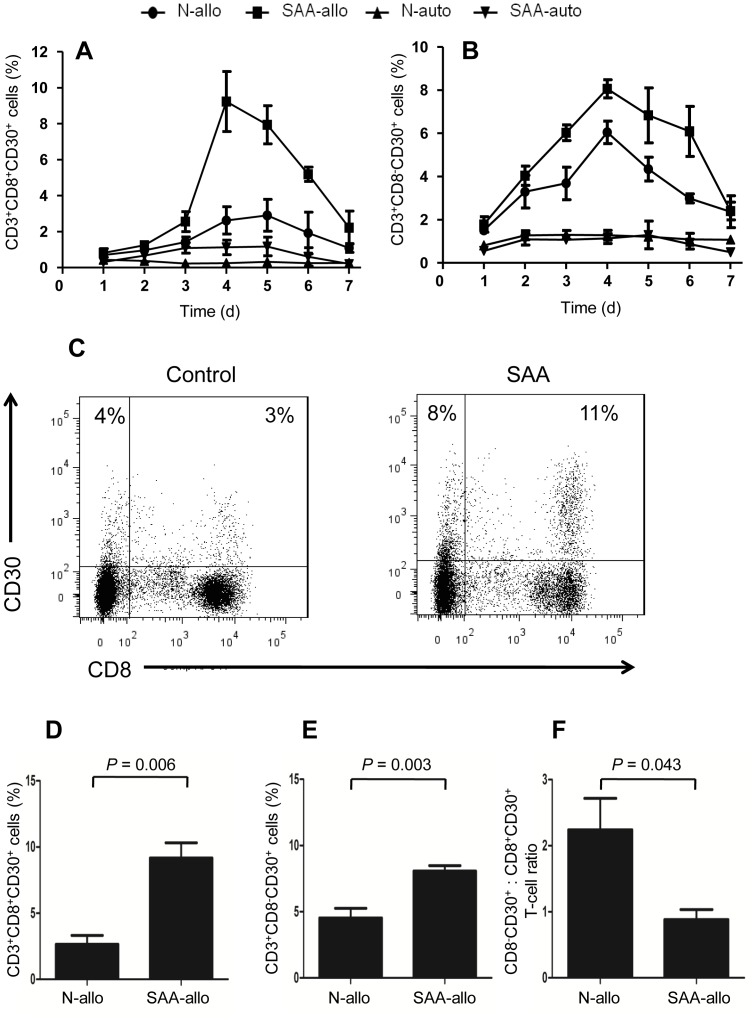
Figure 4. Allogeneic stimulation-induced surface expression of CD30 on T cells.
BM CD3+ T cells from healthy individuals and SAA patients were co-cultured with mitomycin C treated autologous or allogenetic mononuclear cells for a total of 7 days, kinetics of cell surface expression of CD30 by CD3+CD8+ T cells (A) and CD3+CD8− T cells (B) were determined by FCM. Data represent mean ± SE of three independent experiments. (C) Representative FCM analyses of cell surface expression of CD30 by T cells from healthy individuals and SAA patients after allogeneic stimulation. Results at day 4 when the maximum CD30 expression reached were shown. (D) and (E) Cells surface expression of CD30 by allogeneic stimulated T-cell subsets at day 4 were determined in 5 healthy individuals and 6 SAA patients. (F) CD3+CD8−CD30+: CD3+CD8+CD30+ T-cell ratios in healthy individuals and in SAA patients

