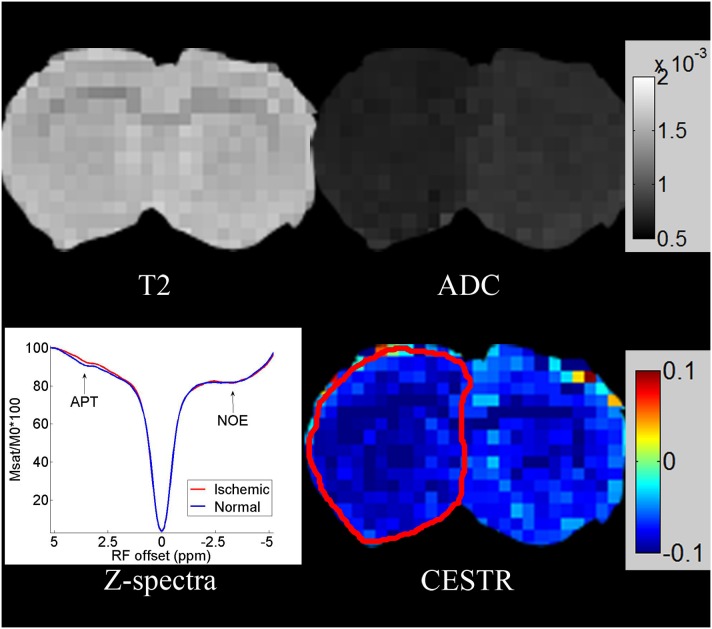
Figure 5. The figure shows the CEST image and Z-spectra of one MCAO SD rat brain using the optimized MT-prepared GRE MRI sequence, and compares them with other routine images.
The CEST effect was verified by the Z-spectra (lower left corner). The CEST effect was reduced due to the decrease of pH in the ischemic lesion, whereas the NOE was almost the same as in the normal region.

