
Figure 2.
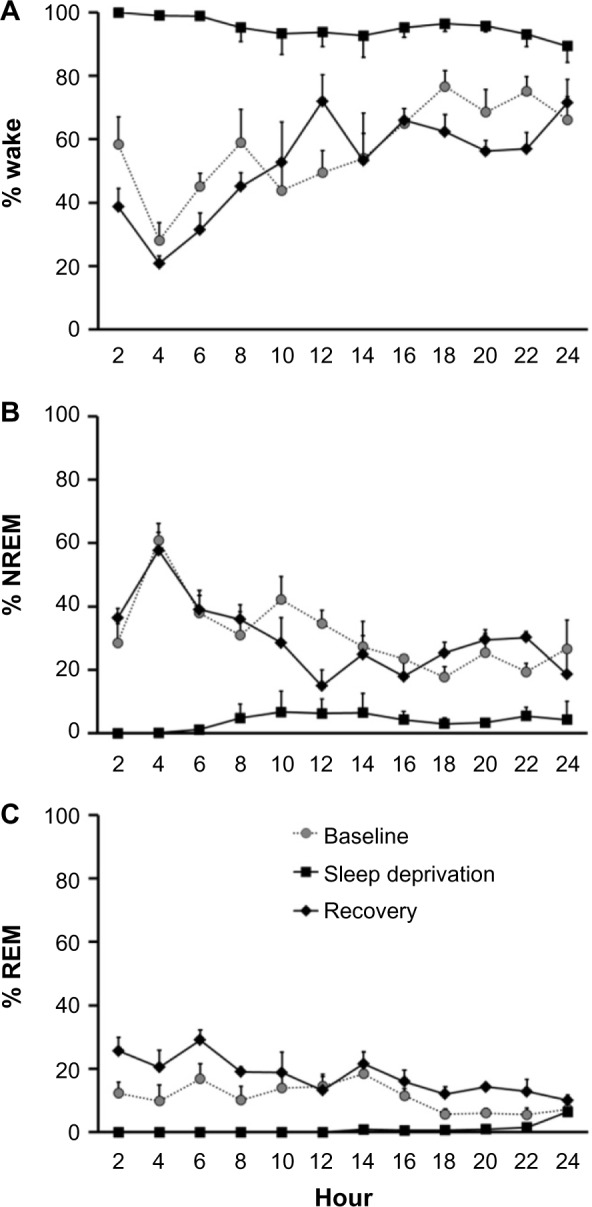
Sleep deprivation protocol reduced amount of time spent in NREM and REM sleep.
Notes: Figure illustrates results of polysomnography of rodents over 3 consecutive days, during baseline (gray dot), sleep deprivation (black square), and recovery (black diamond). Data points represent the mean and SEM percentage of time spent in (A) wake, (B) NREM sleep, and (C) REM sleep. Data points were averaged in 2-hour bins. Lights were on during hours 0–12, and lights were off during hours 12–24.
Abbreviations: NREM, non-REM; REM, rapid eye movement; SEM, standard error of the mean.