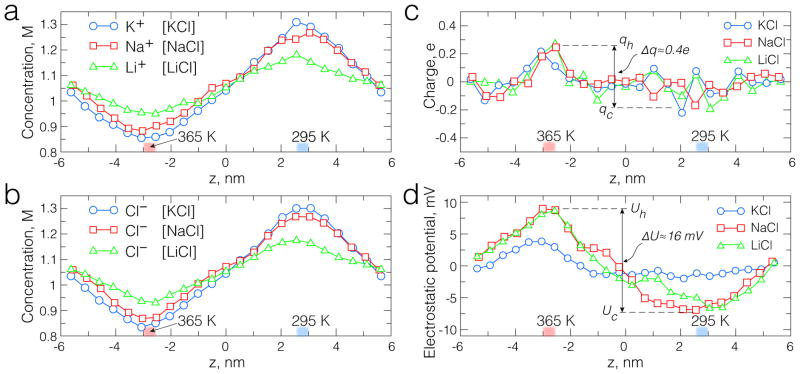
Fig. 2.
The effect of temperature gradient on ion distribution. (a–b) The local concentration of potassium, sodium and lithium ions (a) and chloride ions (b) in the dual-temperature simulations of 1 M KCl, NaCl and LiCl. Each system was simulated for at least 40 ns. The ion concentration was averaged over 5 Å slabs arranged perpendicular to the z-axis. The number of ions within each bin was averaged over the corresponding MD trajectory and divided by the bin volume. (c) The local electric charge of ions in the dual-temperature simulations of 1 M KCl, NaCl and LiCl. (d) The profile of the electrostatic potential along the temperature gradient. The maximum/minimum values are marked with qh/qc in panel c and Uh/Uc in panel d for the charge and potential distributions, correspondingly.

