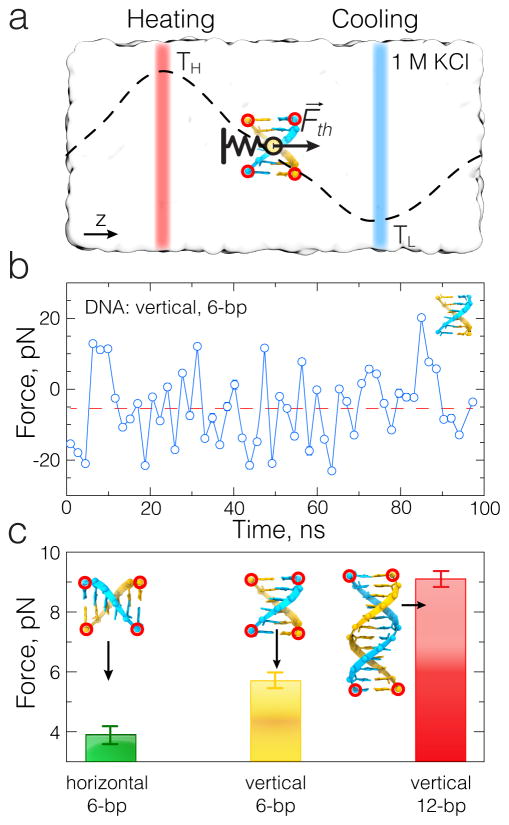
Fig. 4.
Direct measurement of the thermophoretic force using the dual temperature bath setup. (a) Schematic illustration of the direct measurement approach. A model molecule (6 base-pairs fragment of dsDNA) is placed in electrolyte solution shown as a semi-transparent molecular surface. The molecule is harmonically restrained to have its z coordinate equidistant from the two thermally-regulated subvolumes of the system (highlighted as semi-transparent red and blue slabs). The mean displacement of the molecule along the direction of the temperature gradient reports the direction and magnitude of the effective thermophoretic force: , where k is the spring constant of the harmonic restrain. (b) A typical time dependence of the effective force experienced by the model molecule (6-bp dsDNA) in a dual bath thermostat simulation. Each data point in the trace corresponds to the average of 400 instantaneous force measurements recorded during a 2 ns interval. (c) The average force experienced by three fragments of dsDNA in a temperature gradient of 0.42 K/Å( T = 25 K over 6 nm distance). The linear increase of the effective force with the number of basepairs is consistent with the expectations. The dependence of the effective force on the orientation of DNA signifies the asymmetric structure of dsDNA.

