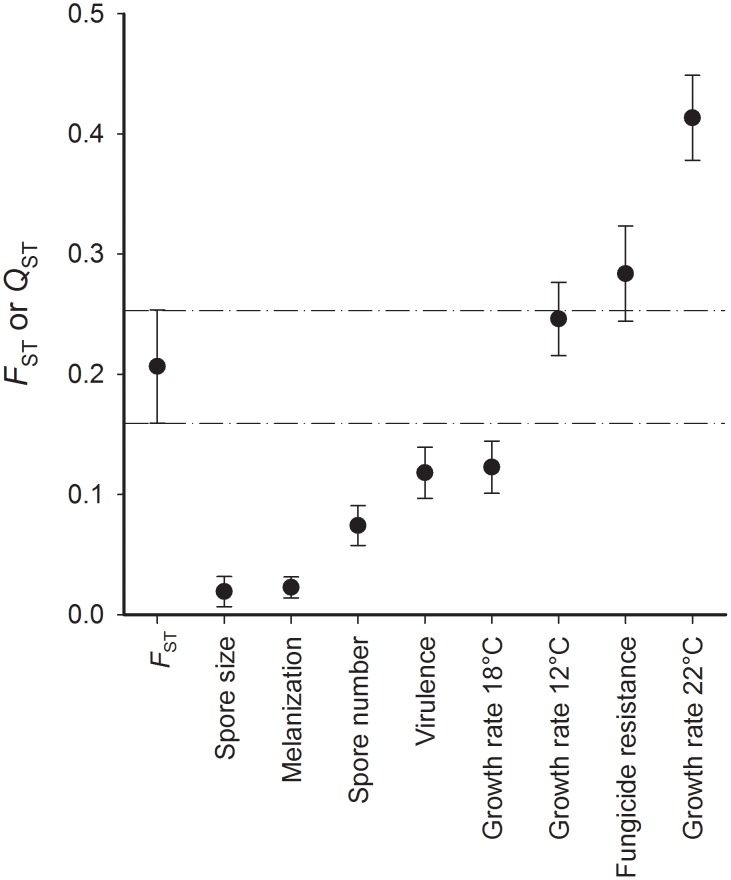
Figure 1. Comparison of genetic divergence estimated by F ST and by Q ST for eight quantitative traits of populations of Rhynchosporium commune.
Q ST values were statistically different from F ST except for growth rate at 12°C and fungicide resistance. Bars represent the 95% confidence interval. The range within the two dashed lines indicates the 95% confidence interval of overall F ST. Traits with Q ST below that range are interpreted as being under stabilizing selection, while traits with Q ST above that range are interpreted as being under diversifying selection. When Q ST and its confidence interval overlap with the F ST range between the dashed lines, neutral evolution acting among populations cannot be excluded.

