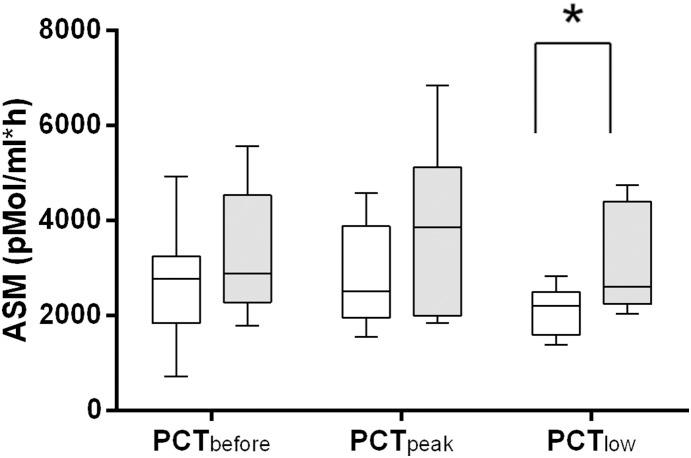
Figure 4. Acid sphingomyelinase serum activity in ICU patients with SIRS.
Clear boxes represent survivors (n = 9) and grey boxes non-survivors (N = 10). Statistically significant difference (P<0.05) between survivors and non-survivors at PCTlow (*) for acid sphingomyelinase serum. The box plots show the minima/maxima (whiskers), 25%/75% percentile (box), and median (−) values. ASM: acid sphingomyelinase serum activity.

