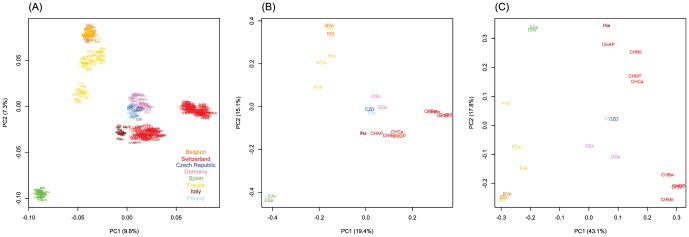
Figure 2. Principal component analysis (PCA) of (A) the neutral binary AFLP data matrix of 444 individuals from 21 populations across Europe using 1,843 neutral and evolutionary informative AFLP markers (see Material and Methods).

(B) PCA of the 21 population-specific allele frequency estimates of neutral AFLP markers by BayeScan. The distribution of the populations on the plot roughly follows the geographic origin of the samples. (C) PCA of the estimated population-based allele frequencies of the 138 outliers probably under positive selection. For population IDs see Table 1. Colours correspond to country affiliation (see Figure 1).
