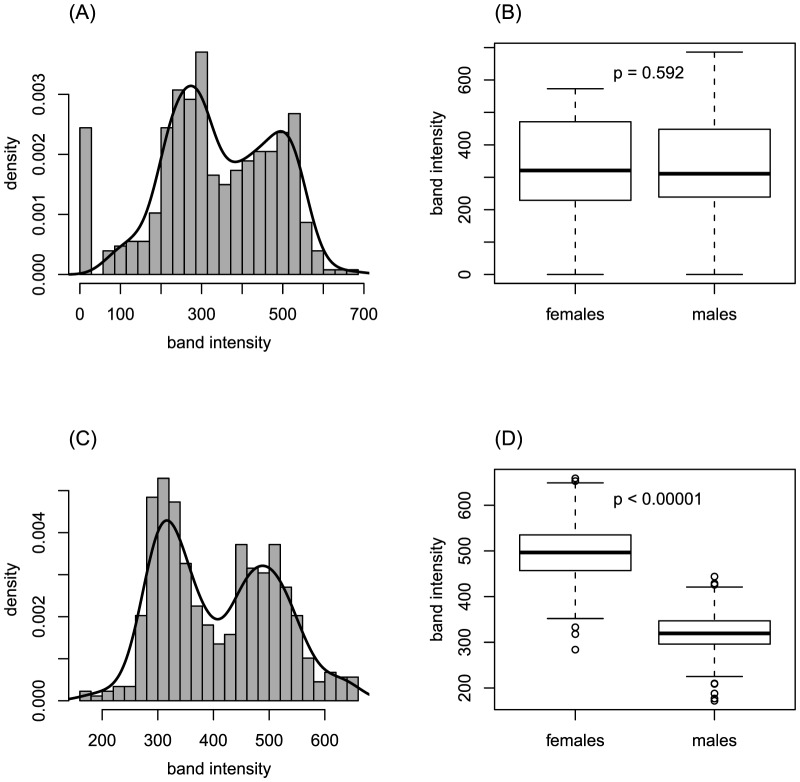
Figure 4. Bimodal band intensity distribution of two low F ST outlier markers.
(A) Bimodal distribution of a marker likely to be under balancing selection (CTaa125). The zero class of the distribution represents individuals not showing any band, the following first peak corresponds to heterozygous individuals and the second peak represents homozygous individuals. The black line represents a fitted density curve. (B) Comparison of band intensities in males and females for marker CTaa125 shown in (A) revealing no statistical difference and suggesting it is an autosomal marker. (C) Bimodal distribution for marker ACtt16. (D) Corresponding box plot of sex-specific band intensities for marker ACtt16 where females have band intensities about twice larger than males, hence suggesting it is an X-linked marker.

