
Figure 5. Allele frequency distributions of a locus potentially under balancing and three loci potentially under positive selection across Europe.
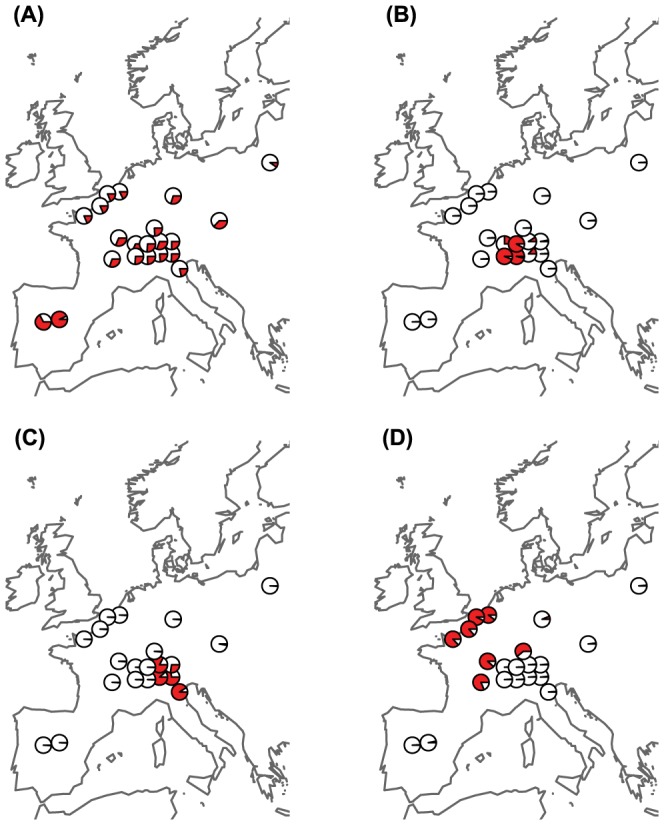
Pie charts indicate the minor allele frequency. (A) Potential patterns of continental balancing selection of the locus CTaa125, which shows very homogenous allele frequencies across Europe. (B–D) Three loci under potential positive selection, which produced the strongest splits (F CT) between two groups of populations across Europe identified by the locus-by-locus SAMOVA approach [82]. Shown are the loci (B) ACag119 with a F CT of 0.93, (C) CTaa3 with a F CT of 0.89, and (D) GGac31 with a F CT of 0.87.