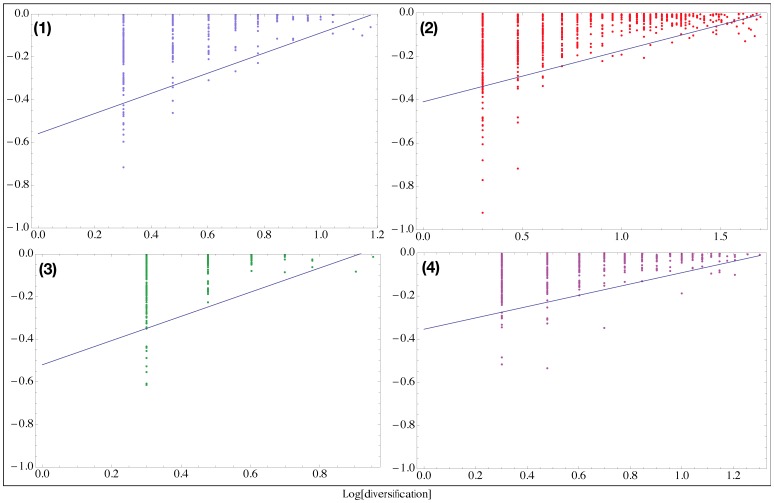
Figure 3. Performance versus diversification in the model.
By making an analogy between the performance as defined in the present model and the revenues of a firm, it is possible to observe a lower boundary extremely similar to those observed in the real data, even in its functional form. The numbered labels indicate respectively the phase zone in Fig. 4.

