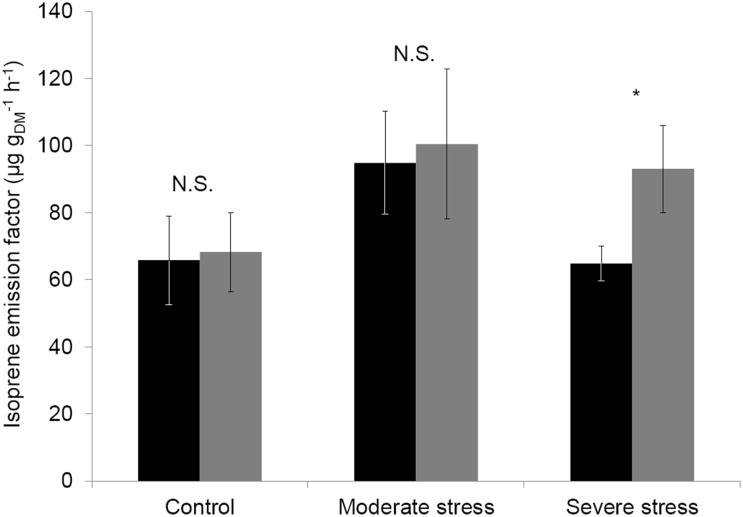
Figure 4. Experimental and calculated isoprene emission factors.
Comparison between the isoprene emission factor calculated with Guenther et al. (1993) algorithm ( ) and the experimental isoprene emission factor (▪) obtained under standard conditions (30±1°C and 1000±50 µmol m−2 s−1 of PPFD) for control, mild and severely water stressed sapling. t: value of the paired sample comparison tests. N.S.: not significant, *0.01<P<0.05. Values are mean ± SE of n = 6–7 saplings.

