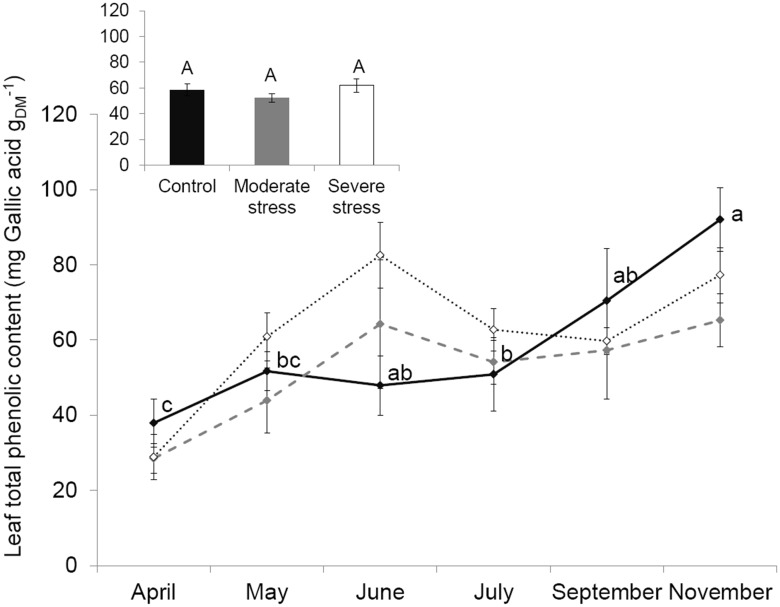
Figure 5. Leaf total phenolic concentration.
Seasonal course of leaf total phenolic concentration under control (–⧫–), mild ( ) and severe (···⋄···) water stress. Differences are tested using a two-way ANOVA (F) followed by Tukey tests. Since interaction between seasonality and treatment was not significant, the impact of water stress is shown in the small embedded graph where data of all months are pooled together and differences between treatments are denoted by capital letters (similar capital letters indicate the absence of water stress influence) while seasonality impact is shown in the main graph (in lower case letters: a>b>c). Values are mean ± SE of n = 5.

