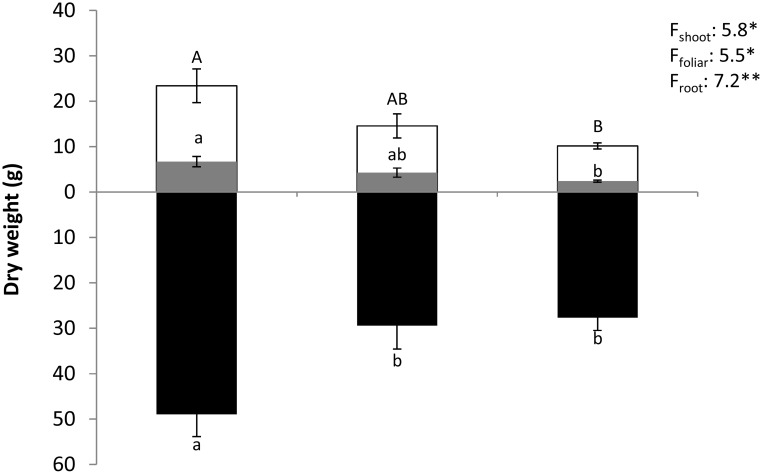
Figure 6. Biomass growth.
Shoot, foliar and root biomass (gDM ind−1) during leaf senescence (in November) for control, mild and severe water stress. Differences are tested with one-way ANOVA (F). Capital black lower case black and white lower case letters denote statistical differences for shoot, foliar and root biomasses respectively with a>b or A>B given by Tukey tests. Values are mean ± SE. n = 5.

