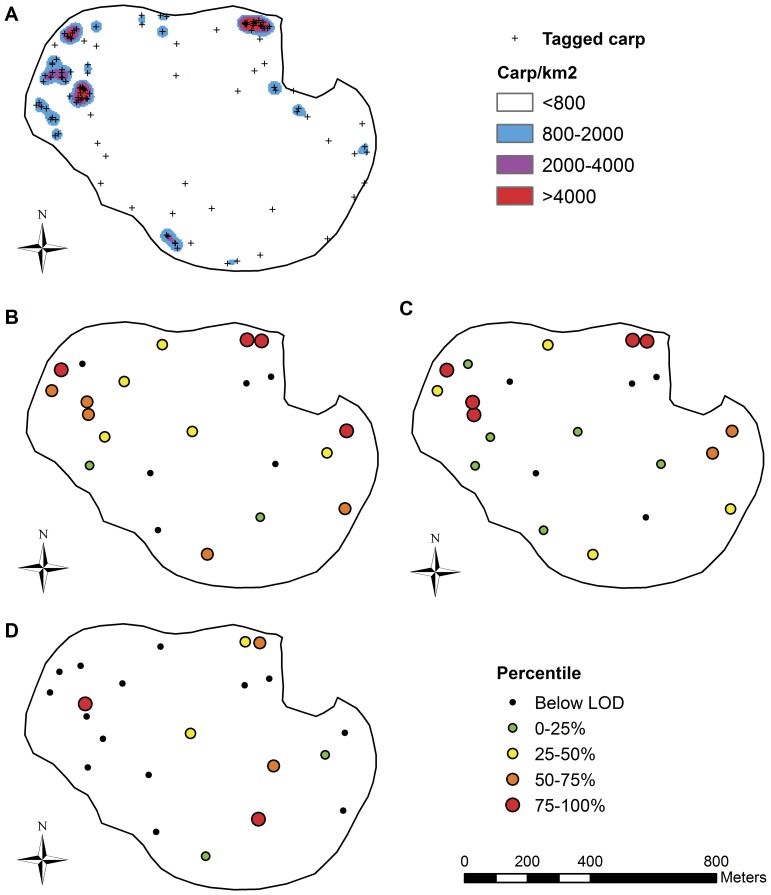
Figure 1. Carp use and distribution of eDNA in Lake Staring.
Panel A shows locations of radiotagged carp and high- and low-use areas. Density categories represent the average number of locations of radiotagged carp/km2. The high- and low-use area cut-off value of 800 radiotagged carp/km2 corresponded to approximately 1,248 carp/ha. Panels B–D show the pattern of eDNA detection and concentration in surface water (B), sub-surface water (C), and sediment (D). All figures have the same scale. The symbol legend in the upper right refers to panel A, whereas lower right refers to panels B–D.

