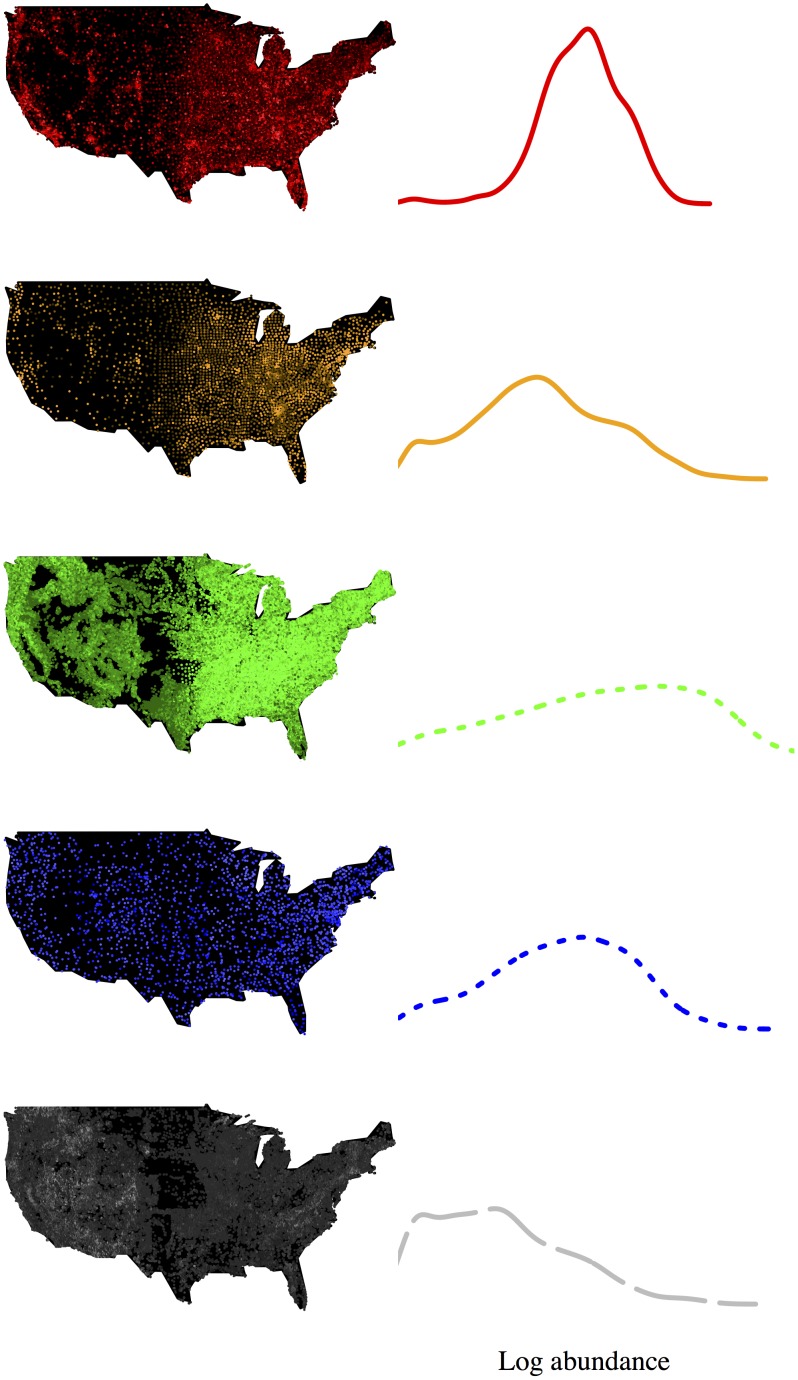
Figure 1. Distribution of objects across categories and space.
Left column, site locations for each dataset (colored as described in Table 2). Site brightness is proportional to richness. Right column, relative abundance distribution for log-transformed abundance data at full scale (a first-order effect). All datasets are shown with the same axes.

