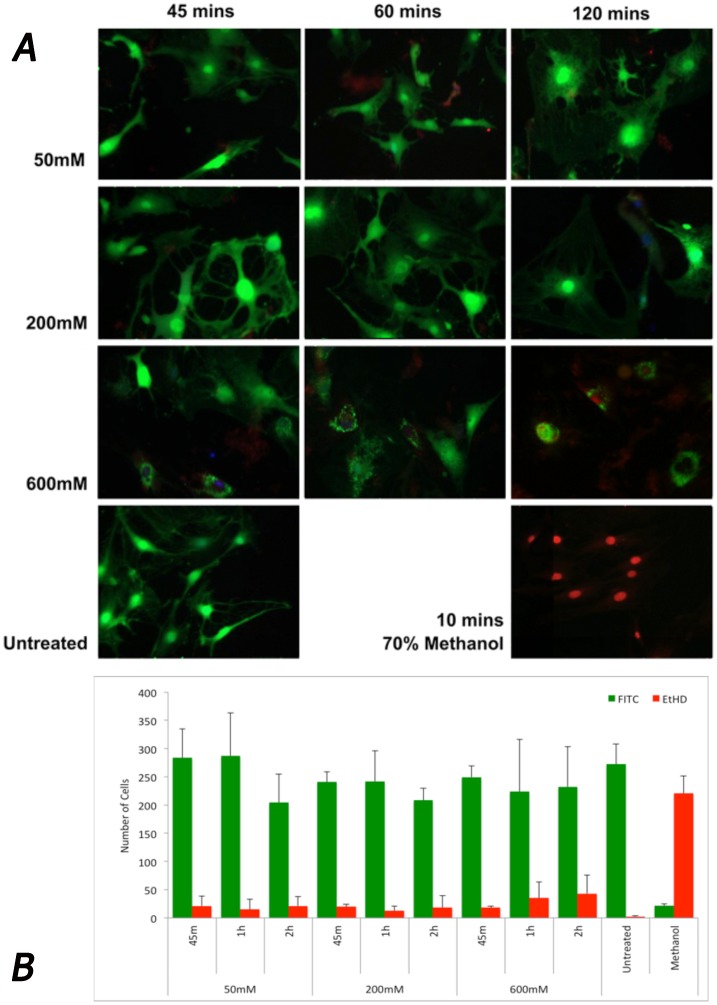
Figure 5. Cell viability following increasing doses of M6P treatment.
A. Live/Dead viability stain used to exhibit cell morphology and cell viability. Living cells uptake calcein AM (green) Ethidium homodimer taken up by dead cells (red). Untreated cells show spindle shaped morphology in confluence whereas treated cells with 50 mM retain their spindle morphology at 45 and 60 minutes of exposure. At 200 mM cells begin to lose their spindle morphology but continue to have cytoplasmic protrusions with evidence of crenation after 120 minutes of exposure. Cells treated with 600 mM showed fewer cytoplasmic protrusions with a considerable shielded appearance after 60 minutes and 2 hours. B. Quantification of the living (green) and dead (red) cells revealed the majority of cells were still viable after all treatments with no significant loss of cellular viability (p>0.05). No significant difference was found between the number of live cells or dead cells found between treatments, dosages or exposure times, except those observed in the negative control (methanol) (p>0.05). Error bars represent standard error of mean.

