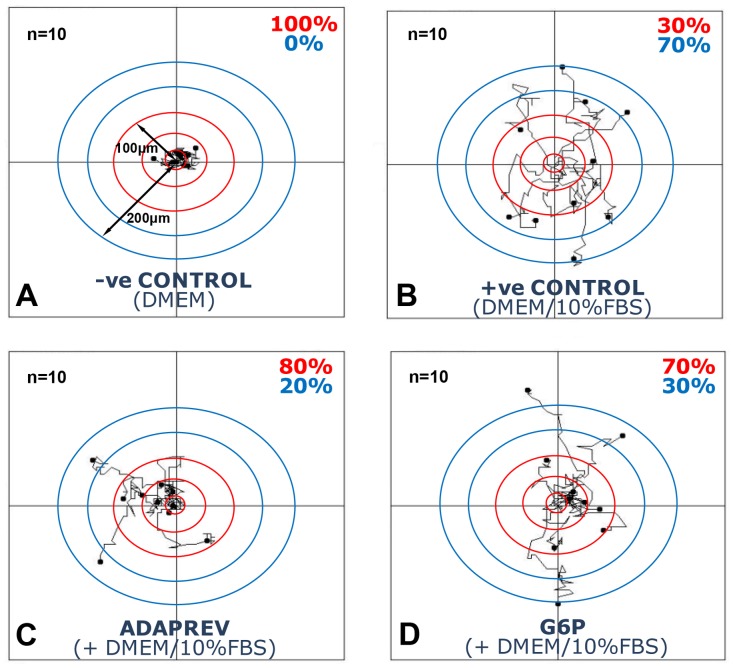
Figure 8. Effect of Adaprev on fibroblast migration (Chemokinesis).
A. Control without 10% FBS. B. Control with 10% FBS. C. M6P with 10% FBS. D. G6P with 10% FBS. Concentric rings indicate 50 µm distance from centre with ten cells measured per treatment group. Note 100% of cells within 100 µm distance with no FBS. Note 70% of cells had migrated beyond 100 µm in DMEM and 10% FBS controls. Adaprev and G6P treatment resulted in a reduction of migration with only 20% and 30% of cells migrating beyond 100 µm.

