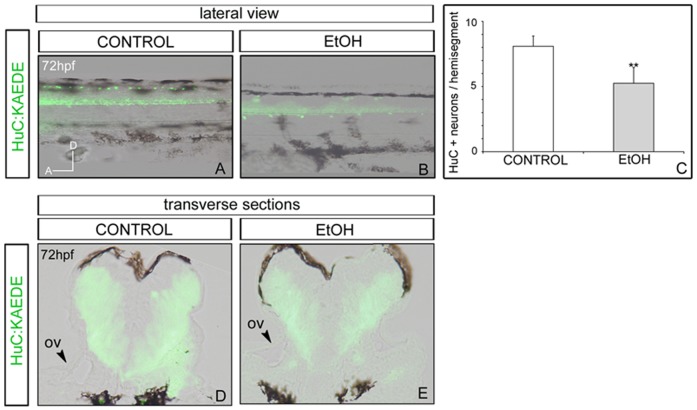
Figure 2. Analysis of Tg[HuC:KAEDE] embryos after ethanol exposure.
Control (A,D), or ethanol-treated embryos (B,E) were analysed for neuronal differentiation. (C) Quantification of KAEDE-positive differentiated neurons per hemisegments. Note that EtOH-treated embryos have less differentiated neurons in the spinal cord. (A-B) Lateral views of 72hpf embryos with anterior to the left. (D-E) Transverse sections at the level of the hindbrain. ov; otic vesicle. ** p<0.005 vs. control group.

