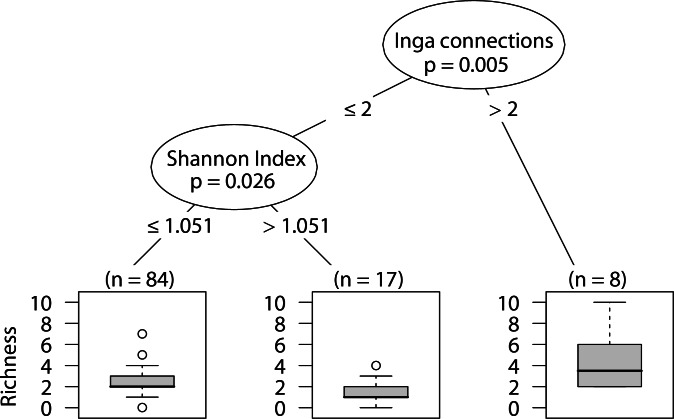
Figure 7. CIT wandering spider richness.
The p-values are listed on each node inside of the encircled explanatory variable which responded strongest to web-building spider abundance. The inner-quartile range of the data is shown in the box plot where the dark horizontal line shows the median and the whiskers show 1.5x inner-quartile range. Circles above the whisker show points that fall beyond 1.5x inner-quartile range. The number of data points (n) is shown above each box plot.

