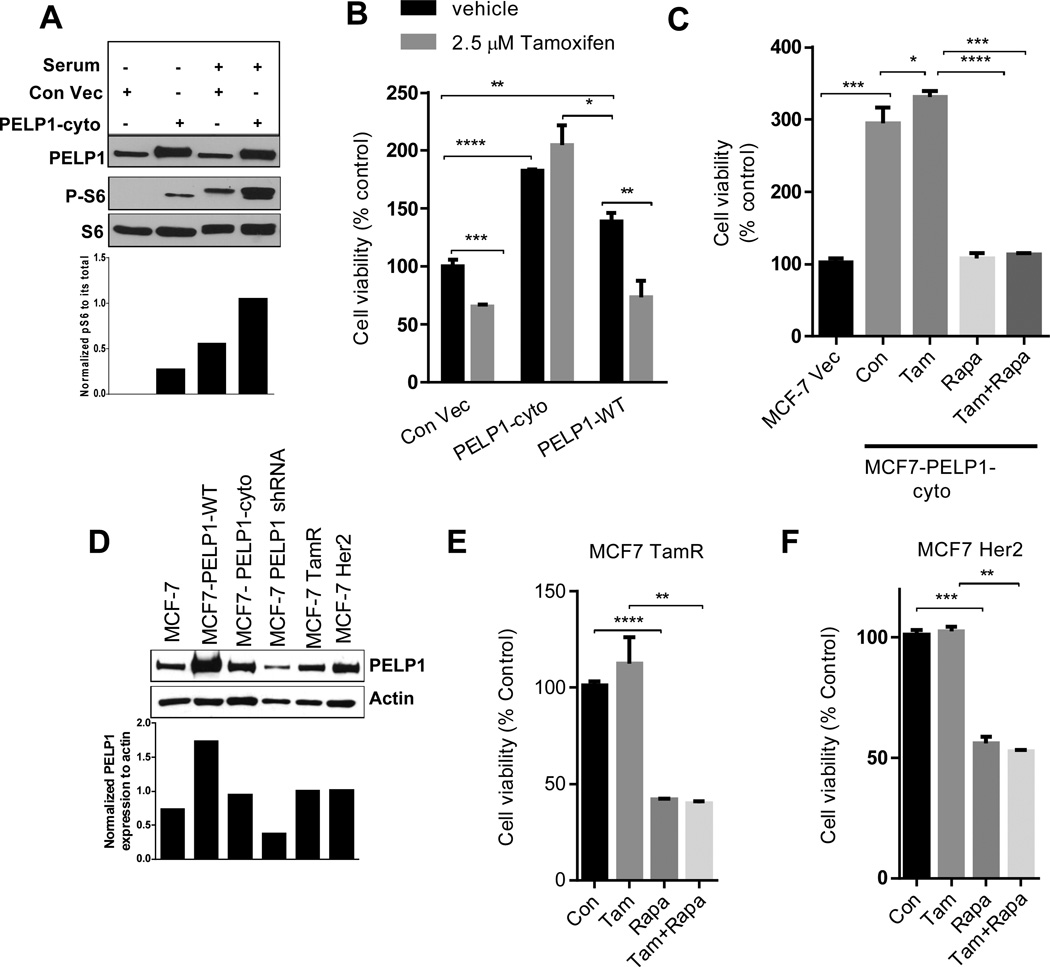
Figure 5. PELP1 cytoplasmic localization promotes mTOR signaling and tamoxifen resistance.
(A) MCF7 cells stably expressing control vector or PELP1-cyto were serum starved for 72 h and stimulated with 10% serum for 10 min. The status of PELP1 expression and S6 phosphorylation was analyzed by Western blotting. Quantitation of S6 phosphorylation after normalizing to its respective total protein is shown. (B) MCF7 control vector, MCF7-PELP1-cyto or MCF7-PELP1-WT cells were treated with vehicle or 2.5µM tamoxifen for 72 h in 5% charcoal-stripped medium and cell viability was assayed by using an MTT assay. (C) MCF7 control vector or MCF7-PELP1-cyto cells were treated with vehicle, 2.5 µM tamoxifen, 20 nM rapamycin or in combination for 7 days in 5% charcoal-stripped medium. After the treatment, cell viability was determined by using an MTT assay. (D) Total lysates from various model cells were analyzed for the expression of PELP1 by Western blotting. (E) MCF7-TamR cells were treated with vehicle, 2.5 µM tamoxifen, 20 nM rapamycin or in combination for 7 days, and cell viability was determined by using an MTT assay. (F) MCF7-HER2 cells were treated with or without 2.5 µM tamoxifen, 20 nM rapamycin or in combination for 7 days, and cell viability was determined by using an MTT assay. Student t-test was used to analyze the data. **P<0.01; ***, P<0.001; ****, P<0.0001.

