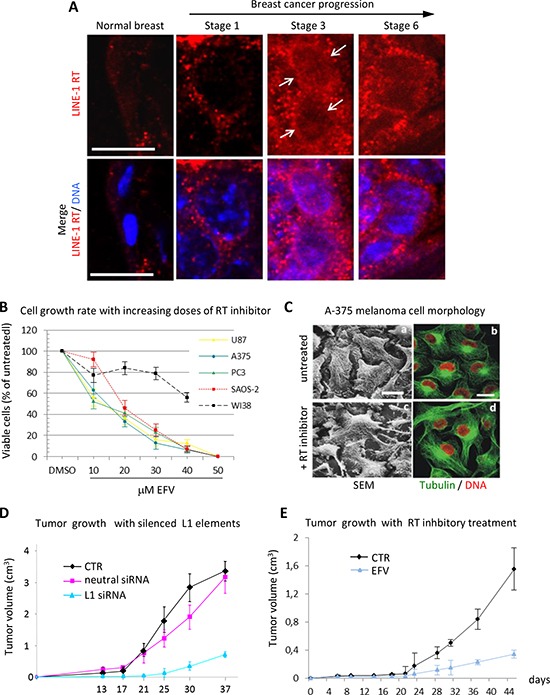
Figure 1. RT inhibition recapitulates the global reprogramming of cancer cell phenotypes observed with LINE-1 element silencing.

(A) Distribution of RT protein (depicted in the top panels in red and, below, in merged confocal images with Hoechst-stained nuclei) during murine mammary cancer progression. Both the abundance and the perinuclear accumulation (arrowed) of RT increase in progressive cancer stages (numbered 1–6; for the description of staging criteria see [69]). Bars, 10 micrometers. (B) The RT inhibitor EFV inhibits proliferation of transformed but not of normal cells. The curves represent the percentage of cells after four days of culture with increasing concentrations of EFV. (C) EFV induces morphological differentiation of A-375 melanoma cells. Scanning electron microscopy (left panels) and confocal microscopy (right panels) depict the cytoskeletal reorganization and the elongated morphology induced by EFV (c-d) compared to the undifferentiated shape of untreated cells (a-b). (D) Reduced tumorigenicity of A-375 melanoma cells interfered for LINE-1 in animal models. Tumor progression was monitored in nude mice inoculated with A-375 cells either untreated, or stably interfered with a neutral, or with LINE-1 (pS-L1i, indicated here as L1-specific siRNAs. Curves show tumor growth (average volume measured in groups of five animals) at the indicated times after melanoma cell inoculation. (E) EFV treatment reduces human A-375 tumor growth in nude mice. A-375 melanoma cells were xenografted in nude mice as for panel D and tumor progression was monitored in animals, either untreated or treated with EFV starting 1 day after cell inoculation. Curves show the mean tumor size in groups of five animals at the indicated times. Experimental details can be found in [69] (panel A), [87] (B), [78] (C and E), [79] (D)
