
Figure 2. GSK-3 inhibition activates NFκB independently of β-catenin and AR.
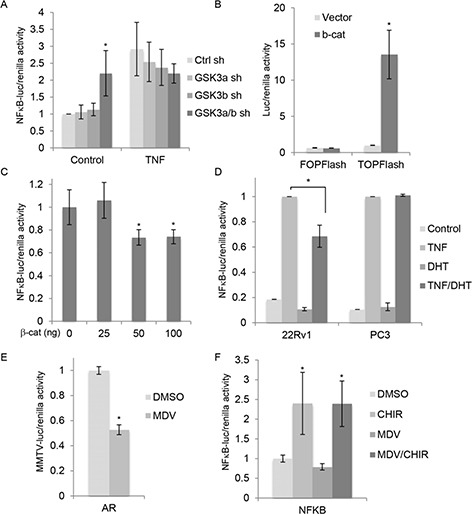
(A) Gene reporter assays using extracts from 22Rv1 cells transfected with control shRNA (Ctrl sh) or shRNAs targeting GSK-3α (GSK3a sh), GSK-3β (GSK3b sh) or both GSK3a/b sh), and plasmids encoding NFκB-luciferase and renilla (pRL-tk), and treated with TNF (20 nM) or vehicle for 6 h. Graph shows luciferase/renilla ratios 18 h after transfection normalized to Ctrl sh; * p < 0.05 vs. Ctrl sh; n = 4. (B) Gene reporter assays using extracts from 22Rv1 cells transfected with plasmid encoding β-catenin or empty vector, Super8xTOPFlash or Super8xFOPFlash and renilla. Graph shows luciferase/renilla ratios normalized to vector; * p < 0.01 vs. vector. (C) Gene reporter assays using extracts from 22Rv1 cells transfected with the indicated amounts of plasmid encoding β-catenin (total amount brought to 200 ng with empty vector), and plasmids encoding NFκB-luciferase and renilla. Graph shows luciferase/renilla ratios, normalized to 0 ng β-catenin plasmid; * p < 0.05 vs. vector. (D) Gene reporter assays using extracts from 22Rv1 cells and PC3 cells transfected with NFκB-Luc and renilla. After transfection, cells were cultured for 18 h in phenol red-free medium containing charcoal-stripped serum with or without 10 nM DHT and then treated with 20 nM TNF for 6 h before measuring luciferase activities. Graph shows luciferase/renilla ratios; TNF-induced activity is set to 100% in each cell line; * p < 0.05; n = 3 (22Rv1), n = 2 (PC3). (E) Gene reporter assays using extracts from 22Rv1 cells transfected with MMTV-luc and renilla, treated with carrier (DMSO) or the AR antagonist 10 uM MDV3100 (MDV) and AR activity determined as in Figure 1F; *p < 0.05 vs. control; n = 2. (F) Gene reporter assays using extracts from 22Rv1 cells transfected with plasmids encoding NFκB-luciferase and renilla and treated with carrier (DMSO), 5 uM CHIR99021 (CHIR) and 10 uM MDV3100 (MDV), as indicated. Graph shows luciferase/renilla ratios normalized to DMSO; * p < 0.05 vs. DMSO; n = 2.