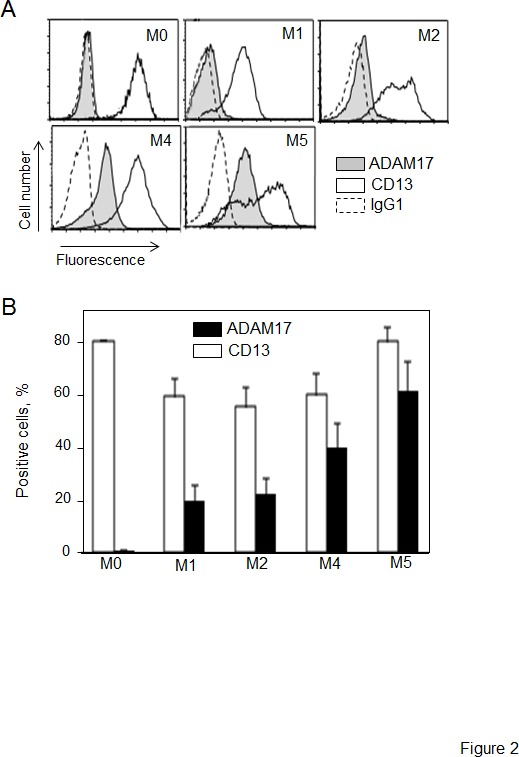
Figure 2. Levels of surface CD13 and ADAM17 expression in primary AML cells.

(A) Representative histograms of M0-, M1-, M2-, M4- and M5-subtype primary AML cells stained with anti-CD13-PE and anti-ADAM17-PE and then examined by flow cytometry analysis. Staining of cells with their isotype IgG1-PE served as the negative control (broken line). (B) Results of the percentage of surface CD13 and ADAM17 expression on AML blast samples (1 M0, 18 M1, 12 M2, 12 M4, 9 M5). Values are expressed as means ± SEM.
