
Figure 3. NTS regulation enhanced EGFR HER2, and HER3 activation in human lung cancer cell lines.
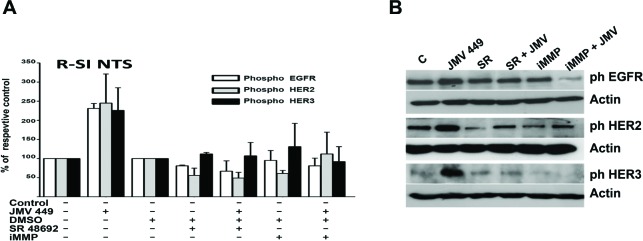
(A) Lung cancer cells R-SI NTS treated or not with 10-7M JMV 449, DMSO, 5x10⁻⁶M SR 48692 or 25 10-9M iMMP for 48h. The histograms representing intensity-based quantification of Western blot bands of phosphorylated protein, EGFR, HER2, and HER3. Values are expressed as the percentage of the non-treated cells (control), and are the mean ± SEM of 3 to 4 independent experiments. (B) An example of a western blot gel of R-SI NTS cells treated with 10-7M JMV449, DMSO, 5x10⁻⁶M SR 4869 or 25 x10-9M iMMP for 48h. Western blots bands of phosphorylated EGFR, HER2, and HER3 protein.