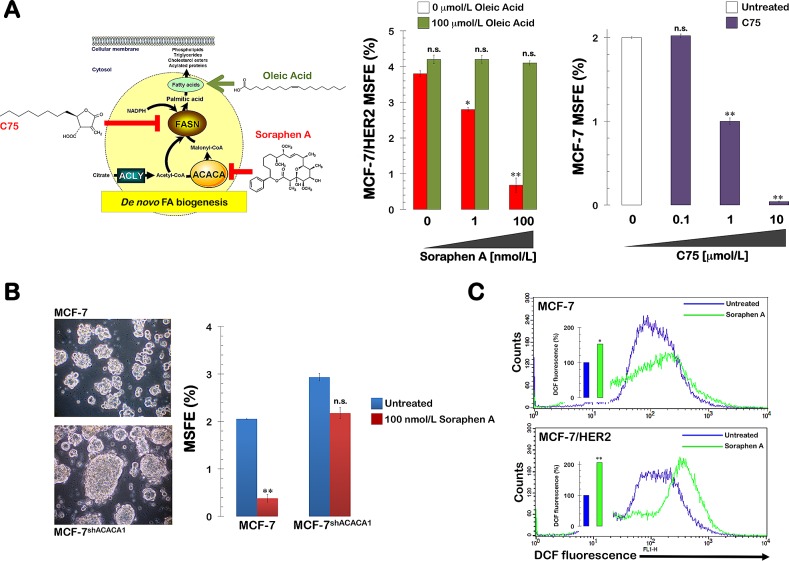
Figure 4. Soraphen A suppresses self-renewal growth of CSC-like cells by blocking ACACA-catalyzed endogenous lipogenesis.
A. Right. MSFE of MCF-7/HER2 cells was calculated as the number of mammospheres (diameter >50 μm) formed in 7 days in the absence or presence of graded concentrations of Soraphen A and co-exposed to 100 μmol/L oleic acid, as specified, divided by the original number of cells seeded and expressed as percentage means (columns) ± SD (bars). Re-feeding of mammospheres cultures with sphere medium, Soraphen A, and/or oleic acid was performed on days 3 and 5. Left. MSFE of MCF-7 cells was calculated as the number B. MSFE of MCF-7 and MCF-7shACACA1 cells was calculated as the number of mammospheres (diameter >50 μm) formed in 7 days in the absence or presence of 100 nmol/L Soraphen A divided by the original number of cells seeded and expressed as percentage means (columns) ± SD (bars). Re-feeding of mammospheres cultures with Soraphen A and/or sphere medium was performed on days 3 and 5. The results in A and B are presented as the mean (columns) ± SD (bars) of 2 independent experiments performed in triplicate. *P < 0.01 and **P < 0.001, statistically significant differences from the control group. n. s. not statistically significant. C. MCF-7 and MCF-7/HER2 cells, untreated or treated for 3 days with 50 nmol/L soraphen A, were exposed for 60 min to H2DCF-DA and their fluorescence intensity was measured by flow cytometry. Figure shows representative scatter plot histograms of DCF fluorescence. The columns at the interior the histograms show relative measurements of ROS levels in soraphen A-treated MCF-7 and MCF-7/HER2 cells compared to untreated controls (=100%). *P < 0.01 and **P < 0.001, statistically significant differences from the control group.

