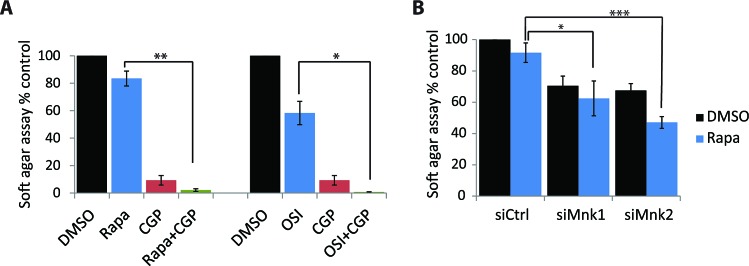
Figure 6. Inhibition of Mnk increases the inhibitory effects of mTOR inhibitors on D556 medulloblastoma cells.

(A) D556 cells were plated in soft-agar and treated with CGP57380 (10 μM) and incubated with or without rapamycin (20 nM) or OSI-027 (0.5 μM). Cells were incubated for 7 days. Colony formation was quantified using the fluorescent cell stain CyQUANT GR Dye (Cell Biolabs Inc.) in the Synergy HT Plate reader. Means ± SE are shown from 4 independent experiments. *, p < 0.05, **, p < 0.005 using a paired t-test (B) D556 cells were transfected with either control, Mnk1 or Mnk2 siRNA. After 48 hours, cells were counted and equal numbers were plated in soft-agar and treated with DMSO as control or rapamycin (10 nM). Cells were incubated for 7 days. Colony formation was quantified using the fluorescent cell stain CyQUANT GR Dye (Cell Biolabs Inc.) in the Synergy HT Plate reader. Means ± SE are shown from 4 independent experiments. Data are expressed as percentages of DMSO treated control siRNA transfected samples. *, p < 0.05, ***, p < 0.0005 using a paired t-test.
