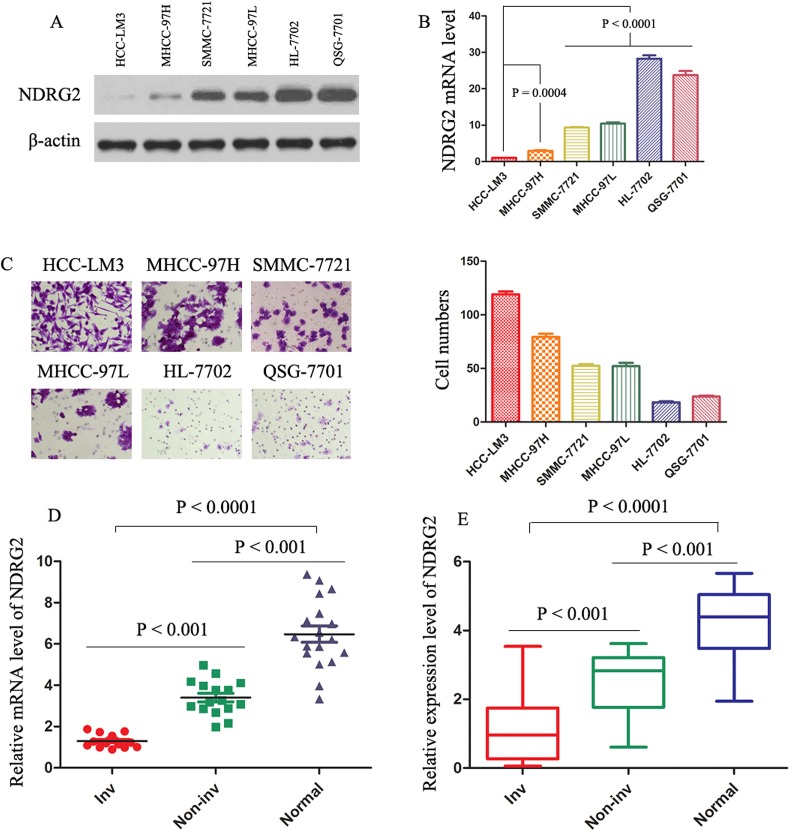
Figure 1. Levels of NDRG2 are decreased in HCC clinical samples, and decreased levels of NDRG2 indicate invasion/metastasis of HCC.
(A) and (B) The protein and mRNA levels were evaluated in the indicated cell lines. The expression of NDRG2 was normalized against β-actin. (C) Cell invasion assay was performed in the indicated cells. The invading cells through the ECM were enumerated 48 hours later. The results represent means ± SD of experiments performed in triplicate. (D) Real-time PCR results of relative expression level of NDRG2 mRNA in 17 normal liver (Normal), 16 HCC without vascular invasion (Non-inv), and 15 HCC with vascular invasion (Inv) samples. mRNA levels of NDRG2 were normalized against β-actin. The results represent means ± SD of experiments performed in triplicate. (E) Protein levels of NDRG2 were determined in 15 Normal, 15 Non-inv, and 15 Inv samples. Box plot graph showed the statistical analysis of NDRG2 expression in all samples. The expression of NDRG2 was normalized against β-actin.

