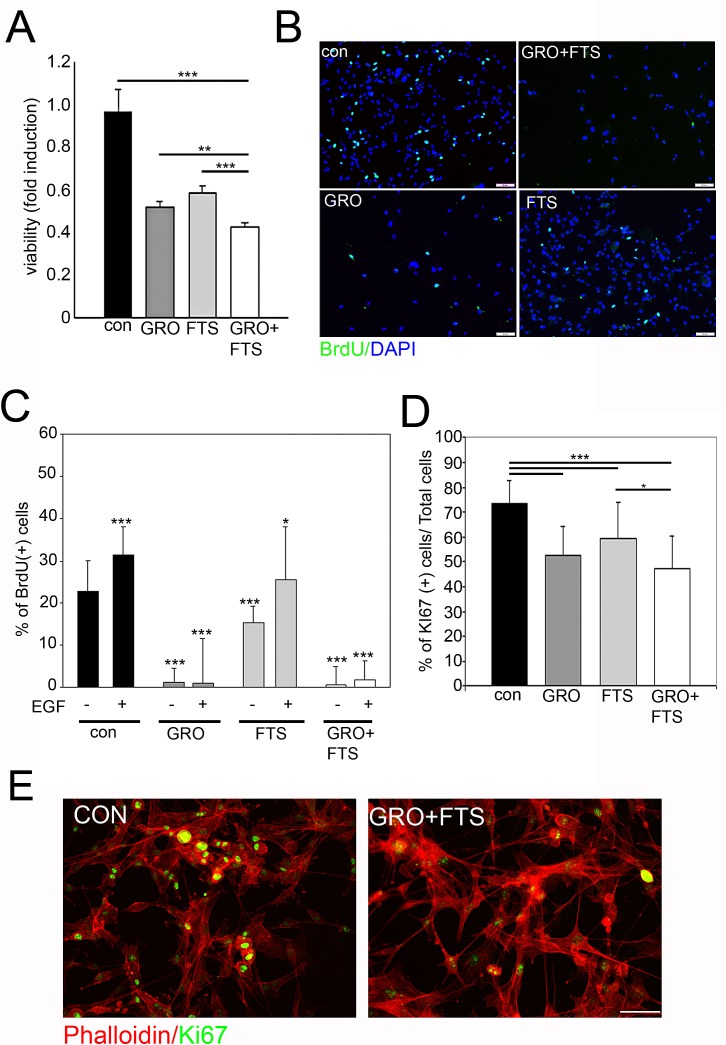
Figure 3. Ras and nucleolin inhibition reduces cell proliferation.
U87-MG cells were treated with FTS 75μM, in the presence or in the absence of 10μM GroA. A. Viability was tested after 5 days of treatment, using the methylene blue staining assay. Cell proliferation was assayed after 3 days of treatment by BrdU incorporation (B and C) and Ki67 staining (D and E). In each field the percentage of proliferating cells was estimated by counting the BrdU/Ki67-positive cells relative to the total number of cells (DAPI counts). Results are mean ± SEM (n =3 experiments; *p<0.05, **p<0.01, ***p<0.001, one-way ANOVA; 20-30 fields were analyzed per treatment) in A, C, D. Scale bars in B and E is 10μm.

