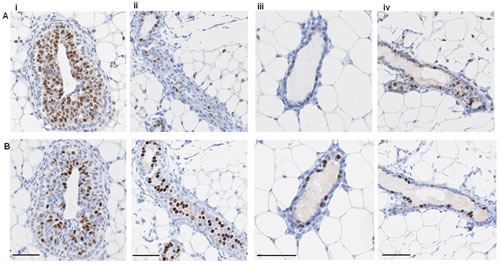
Figure 2. ER and PR expression in mouse mammary gland.

Representative IPX images of adjacent sections of mouse mammary gland showing (A) ER and (B) PR expression at (i) 5 week virgin, (ii) estrous, (iii) diestrous, and (iv) proestrous. Scale bars represent 50 μm.
