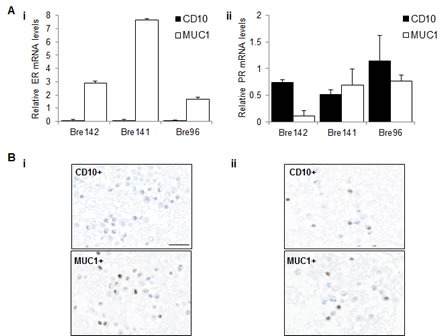
Figure 3. ER and PR expression in luminal and basal cell subsets.

A Relative mRNA levels of ER (i) and PR (ii) were normalised to TBP in basal CD10+ and luminal MUC1+ subpopulations. Graphs represent the mean + SE in independent experiments using tissue from 3 different patients. B Representative images showing IPX staining for (i) ER and (ii) PR in sorted CD10+ and MUC1+ fractions. Scale bar represents 25 μm.
