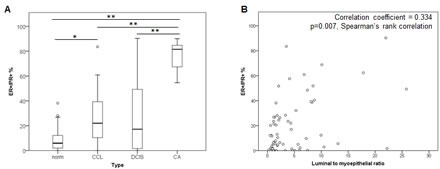
Figure 4. ER and PR expression in a cohort of normal, pre-invasive and breast tumor samples.

A Boxplots of the proportions of ER+/PR+ co-expressing cells across a spectrum of normal (norm; n=22), CCL (n=22), DCIS (n=22) and invasive breast cancer (CA; n=7) samples. ** = p<0.001, * = p<0.01. B Scatter plot of distribution of luminal to myoepithelial ratio and percentage of ER+/PR+ co-expressing cells.
