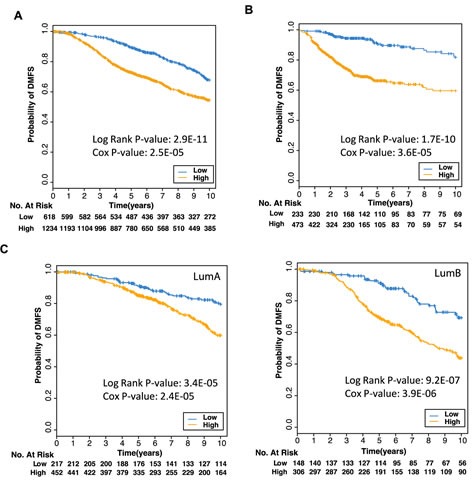
Figure 6. Expression of 18 genes predicts poorer prognosis.

Kaplan Meier plot of probability of survival where patient samples from the (A) METABRIC breast cancer microarrays, or (B) from three different datasets (GSE25055, GSE25065, GSE7390), were stratified into low or high risk groups based on low (blue) or high (orange) expression of the 18 genes found to be correlated with both ER (ESR1) and PR (PGR) expression in cancers. C Kaplan Meier plots of patient samples from Luminal A tumors (left panel) or Luminal B tumors (right panel) in the METABRIC dataset were stratified into low or high risk groups.
