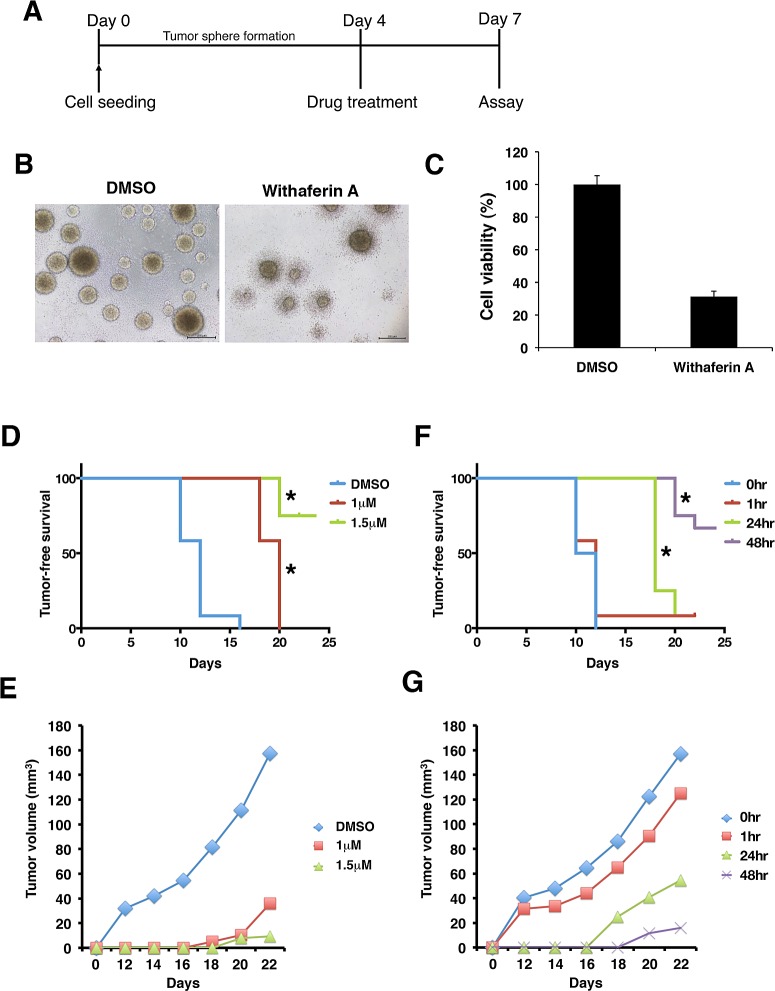
Figure 6. Withaferin A disrupts microenvironment and tumorigenicity of iCSCL-10A cells.
(A-C) Time schedule of the experiment (A). iCSCL-10A cells were dissociated and then cultures for 4 days to form spheres in ultra-low attachment surface plates followed by the treatment of WA for another 3 days. At 7 days, cell viability was monitored by CellTiter-Glo™ Luminescent Cell Viability Assay (C). Values represent the mean ± SEM (n = 3). Phase contrast images of tumor spheres (B). (D, E) iCSCL-10A cells were pre-treated with the indicated concentrations of WA for 72 hrs, and the tumor seeding ability of the cells was assessed by injecting 1×10⁶ cells into nude mice. The tumor initiation ability per injection was monitored at different concentrations. Kaplan–Meier tumor-free survival curves mice receiving each cell types after injection at day 0. Statistically significant differences were observed between DMSO v.s. 1 mM and DMSO v.s. 1.5 mM, respectively (*, P<0.01) (D). Tumor size was monitored with by external caliper at indicated time points (E). Data represent means of 12 mice per condition. (F, G) iCSCL-10A cells were treated with 1.5 μM of WA for the indicated amount of time. WA treated cells (1×10⁶ cells) were then injected subcutaneously into nude mice and the tumor initiating ability of the cells was then monitored over time. Tumor-free survival (F) and tumor size (G) was monitored as in (D) and (E). Statistically significant differences were observed between 0 hr v.s. 24 hr and 0 hr v.s. 48 hr, respectively (*, P<0.01). Data represent means of 12 mice per condition.

