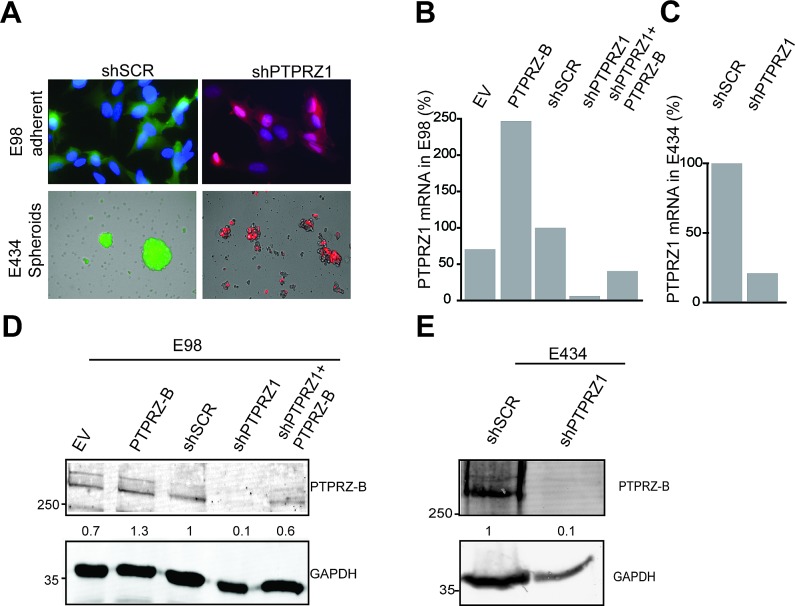
Figure 1. PTPRZ1 expression or knock-down in E98 and E434 cells.
A) Fluorescent images of glioma cells containing shSCR or shPTPRZ1 knock-down constructs carrying GFP or TagRFP fluorescent reporters, respectively. E98 cells were DAPI counterstained. B) PTPRZ1 mRNA levels in lentivirally transduced E98 cells were determined by qRT-PCR. Expression, normalized to β-actin, is given as percentage of that in control shRNA-expressing (shSCR) cells. EV; empty vector control. C) Normalized PTPRZ1 mRNA levels in lentivirally transduced E434 spheroids, determined by qRT-PCR. D) E98 cells were lentivirally transduced with expression constructs for PTPRZ-B protein or EV and/or PTPRZ1 or control (SCR) shRNAs. After three days, lysates were analyzed on immunoblots using PTPRZ-B (upper) and GAPDH (lower) antibodies. Normalized PTPRZ-B levels, relative to that in shSCR control lysates, are depicted in between the blot images. Molecular weight indications (in kDa) are on the left. E) Immunoblot analysis (as in D) of E434 lysates 72 hrs after lentiviral transduction with the indicated constructs.

