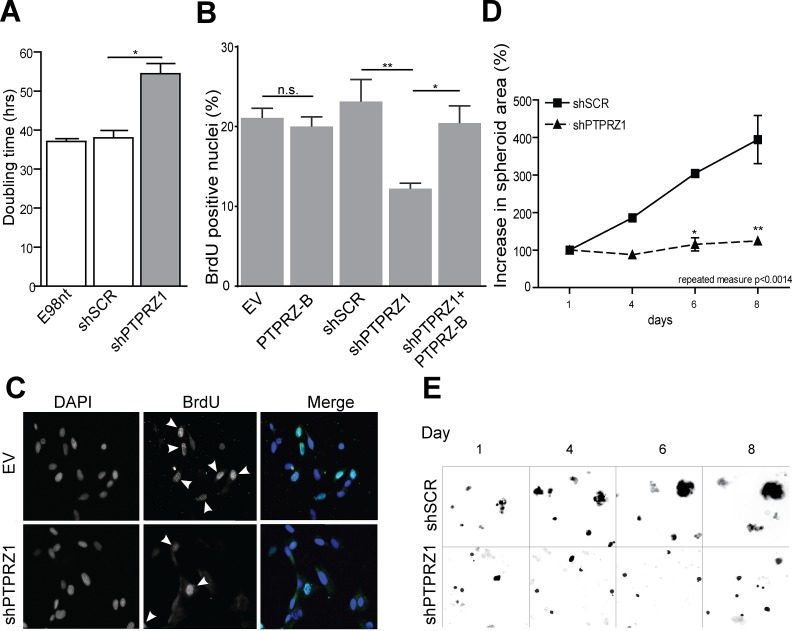
Figure 2. PTPRZ1 knock-down impairs glioma cell growth.
A) E98 cells expressing shSCR or shPTPRZ1 knock-down constructs and non-transduced (E98nt) controls were cultured in microtiter plates, total cell mass was determined at various time points, and population doubling times were calculated from resulting curves. Error bars indicate SD, asterisk indicates p<0.05 (Student t-test, n=3). B) Transduced E98 cells were grown on coverslips and labeled with BrdU for 1 hr. Percentage of BrdU-positive nuclei among DAPI-stained cells was determined (n>3). Error bars indicate SD. Asterisks reflect confidence levels (ANOVA; * p<0.05; ** p<0.01; n.s., not significant). C) Representative images from (B), showing DAPI and BrdU (arrowheads) positivity. D) Transduced E434 cells were seeded into a 96-well plate and images were collected at indicated time points. Increase in spheroid size relative to day 1 is depicted. Error bars indicate SEM and asterisks indicate significance levels (* p<0.05; ** p<0.01). Repeated measure ANOVA: p<0.0014. E) Representative images from (C), exploiting TagRFP and GFP autofluorescence in shRNA vectors.

