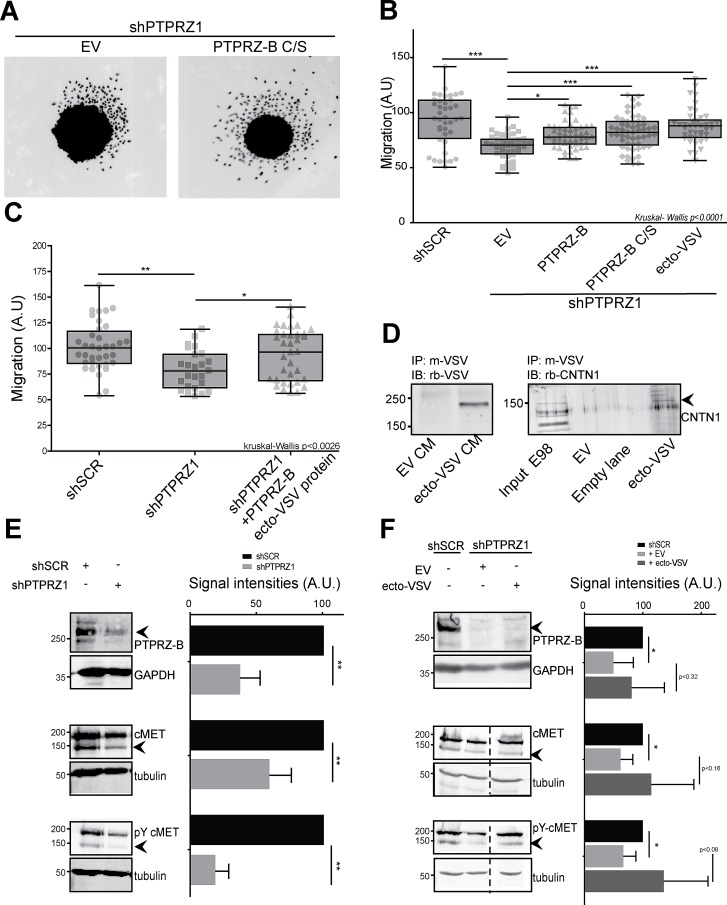
Figure 6. The PTPRZ-B ectodomain stimulates glioma migration.
A) E98 or E98 shPTPRZ1 cells were lentivirally transduced with indicated constructs. Three days later spheroids were generated and the next day seeded on a thin Matrigel layer. After being cultured for another 24 hrs cells were fixed and stained with DAPI. Pictures were collected and two representative images are shown. B) Using these images the migration, in arbitrary units, was calculated per spheroid (light grey data points) as the average distance cells traveled from the spheroid border using FIJI-based software. Box-plot whiskers represent minimum and maximum values. Significance levels are indicated by asterisks (* p<0.05; ** p<0.01; *** p<0.001; Kruskal-Wallis p<0.0001). C) Using the above set-up, spheroid migration was also determined following addition of immunopurified PTPRZ-B ecto-VSV to E98 shPTPRZ1 cells (shPTPRZ1 +PTPRZ-B ecto-VSV protein) during the 24 hrs of culturing on Matrigel. Kruskal-Wallis p<0.003. D) PTPRZ-B ecto-VSV was immunopurified, using mouse anti-VSV monoclonal antibody-coupled beads, from conditioned medium (CM) of HEK-293FT cells transfected with PTPRZ-B ecto-VSV (ecto-VSV) or empty vector (EV) expression plasmids (left panel). Subsequently, beads were incubated with E98 whole cell lysates and co-purifying proteins were analyzed on western blots using Contactin-1 antiserum (right panel). E) Lysates of E98 cells, that were transduced with indicated shRNA constructs and blasticidin-selected, were prepared and analyzed on immunoblots. Molecular weight markers (kDa) are indicated on the left. Upper panels: PTPRZ-B immunostaining, using GAPDH as loading control. Middle and lower panels: blots were probed with antisera against MET (middle) and Y1234-1235-phosphorylated MET (lower) while tubulin staining served as control. Representative images are shown. On the right, the quantification (n>3) of normalized signal intensities (arbitrary units) is given. Error bars indicate SD and asterisks reflect significance based on one-sample Student t-test (** p<0.01). F) E98 shPTPRZ1 cells were transduced with indicated constructs and 72 hrs later whole cell lysates were prepared and analyzed as described under (E). E98 shSCR cell lysate was included for comparison. Representative images are shown on the left and quantification (n>3) of normalized signal intensities (arbitrary units) is given on the right. Dashed lines indicate removal of in-between lanes from the depicted blots. Error bars indicate SD and asterisks reflect significance (* p<0.05, Student t-test).

