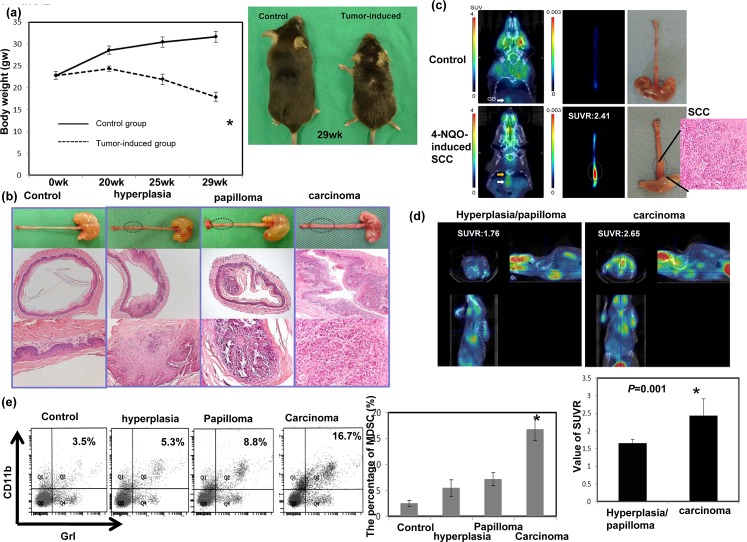
Figure 2. Evaluation of esophageal tumor formation using histological examination and micro animal PET imaging and its relationship with MDSC recruitment.
a. The body weights of animals that consumed drinking water containing the carcinogen 4-NQO or vehicle (propylene glycol, control). The data represent the means ± SEM of five animals per group at the indicated times. *, p<0.05. A representative image of mice 13 weeks after a 16-week 4-NQO treatment period is shown. b. Images of the gross lesions and pathological findings of tissue sections from the animals treated with 4-NQO or vehicle for 16 weeks that were followed for 12–14 weeks. Histological determinations included hyperplasia, papilloma, and invasive carcinoma. c. Representative PET images from the mice treated with 4-NQO and diagnosed with invasive carcinoma, compared with the control. The tumor-to-muscle SUVR was calculated from the micro-PET scans. d. Representative PET images from mice treated with 4-NQO and diagnosed with hyperplasia/papilloma or invasive carcinoma. The tumor-to-muscle SUVR was calculated from the micro-PET scans. Data points represent the means ± SEMs. *, p<0.05. e.Flow cytometric analysis of CD11b+Gr1+ cells from mice exhibiting hyperplasia/papilloma or invasive carcinoma after histological analysis. Representative images and quantitation are shown. The columns represent the means ± SEM. *, p<0.05.

