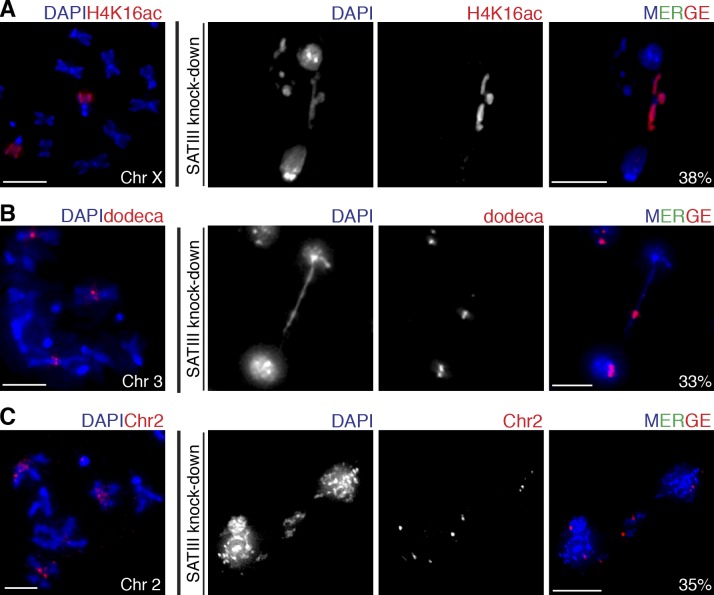
Figure 3.
SAT III depletion affects segregation of all chromosomes. (A) H4K16ac is highly enriched at the X chromosome. H4K16ac localization analysis on metaphase chromosome spreads from S2 cells is shown. After SAT III depletion, lagging chromosomes were stained for H4K16ac (38%, n = 50), indicating that depletion of SAT III also affects chromosome X. (B) Dodeca satellite localizes to centromeric region of chromosome 3. Dodeca DNA FISH analysis of metaphase chromosome spreads from S2 cells is shown. After SAT III depletion, lagging chromosomes were labeled with dodeca probe (33%, n = 43), indicating that depletion of SAT III affects chromosome 3. (C) Chromosome 2 is labeled with a (AAGAG)6 satellite probe that binds to a large block of this satellite on chromosome 2. After SAT III depletion, a portion of lagging chromosomes (35%, n = 49) were labeled, indicating that depletion of SAT III affects chromosome 2. Bars, 5 µm.

