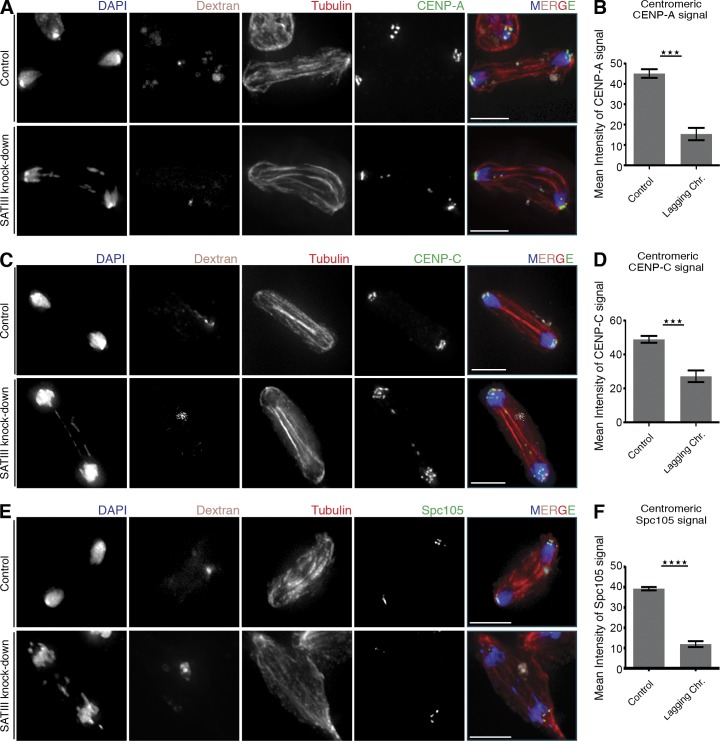
Figure 5.
Levels of centromeric and kinetochore proteins are reduced on lagging chromosomes after SAT III depletion. (A) Lagging chromosomes after SAT III knockdown display CENP-A signals. Cells were cotransfected with fluorescein-labeled dextran to distinguish LNA-transfected from untransfected cells. (B) Quantification of centromeric CENP-A signal mean intensity of cells in A. CENP-A levels were compared from lagging and successfully segregated chromosomes. Depicted are the normalized values from three independent experiments (n = 38). Only dextran-positive cells were analyzed. The CENP-A signal intensities are significantly (P < 0.0001) decreased on the lagging chromosomes. The p-value was determined using the Student’s t test. (C) Lagging chromosomes after SAT III knockdown display CENP-C signals. Cells were cotransfected with fluorescein-labeled dextran to distinguish LNA-transfected from untransfected cells. (D) Quantification of centromeric CENP-C signal mean intensity of cells as shown in C. Depicted are the normalized values from three independent experiments (n = 49). The CENP-C signal intensities are significantly (P < 0.0001) decreased on the lagging chromosomes. (E) Lagging chromosomes after SAT III knockdown display virtually no Spc105 signals. Cells were cotransfected with fluorescein-labeled dextran to distinguish LNA-transfected from untransfected cells. (F) Quantification analysis of centromeric Spc105 signal mean intensity of cells as shown in E. Depicted are the normalized values from four independent experiments (n = 96). The Spc105 signal intensities are significantly (P < 0.0001) decreased on the lagging chromosomes. Data are mean ± SEM (error bars). The asterisks represent the p-value summary. Bars, 5 µm.

